Create logs viewer
- How-to guide
- 5-min read
In this guide, you'll learn how to create simple visualizations to gather insights from your log data.
The LogFieldDistribution component
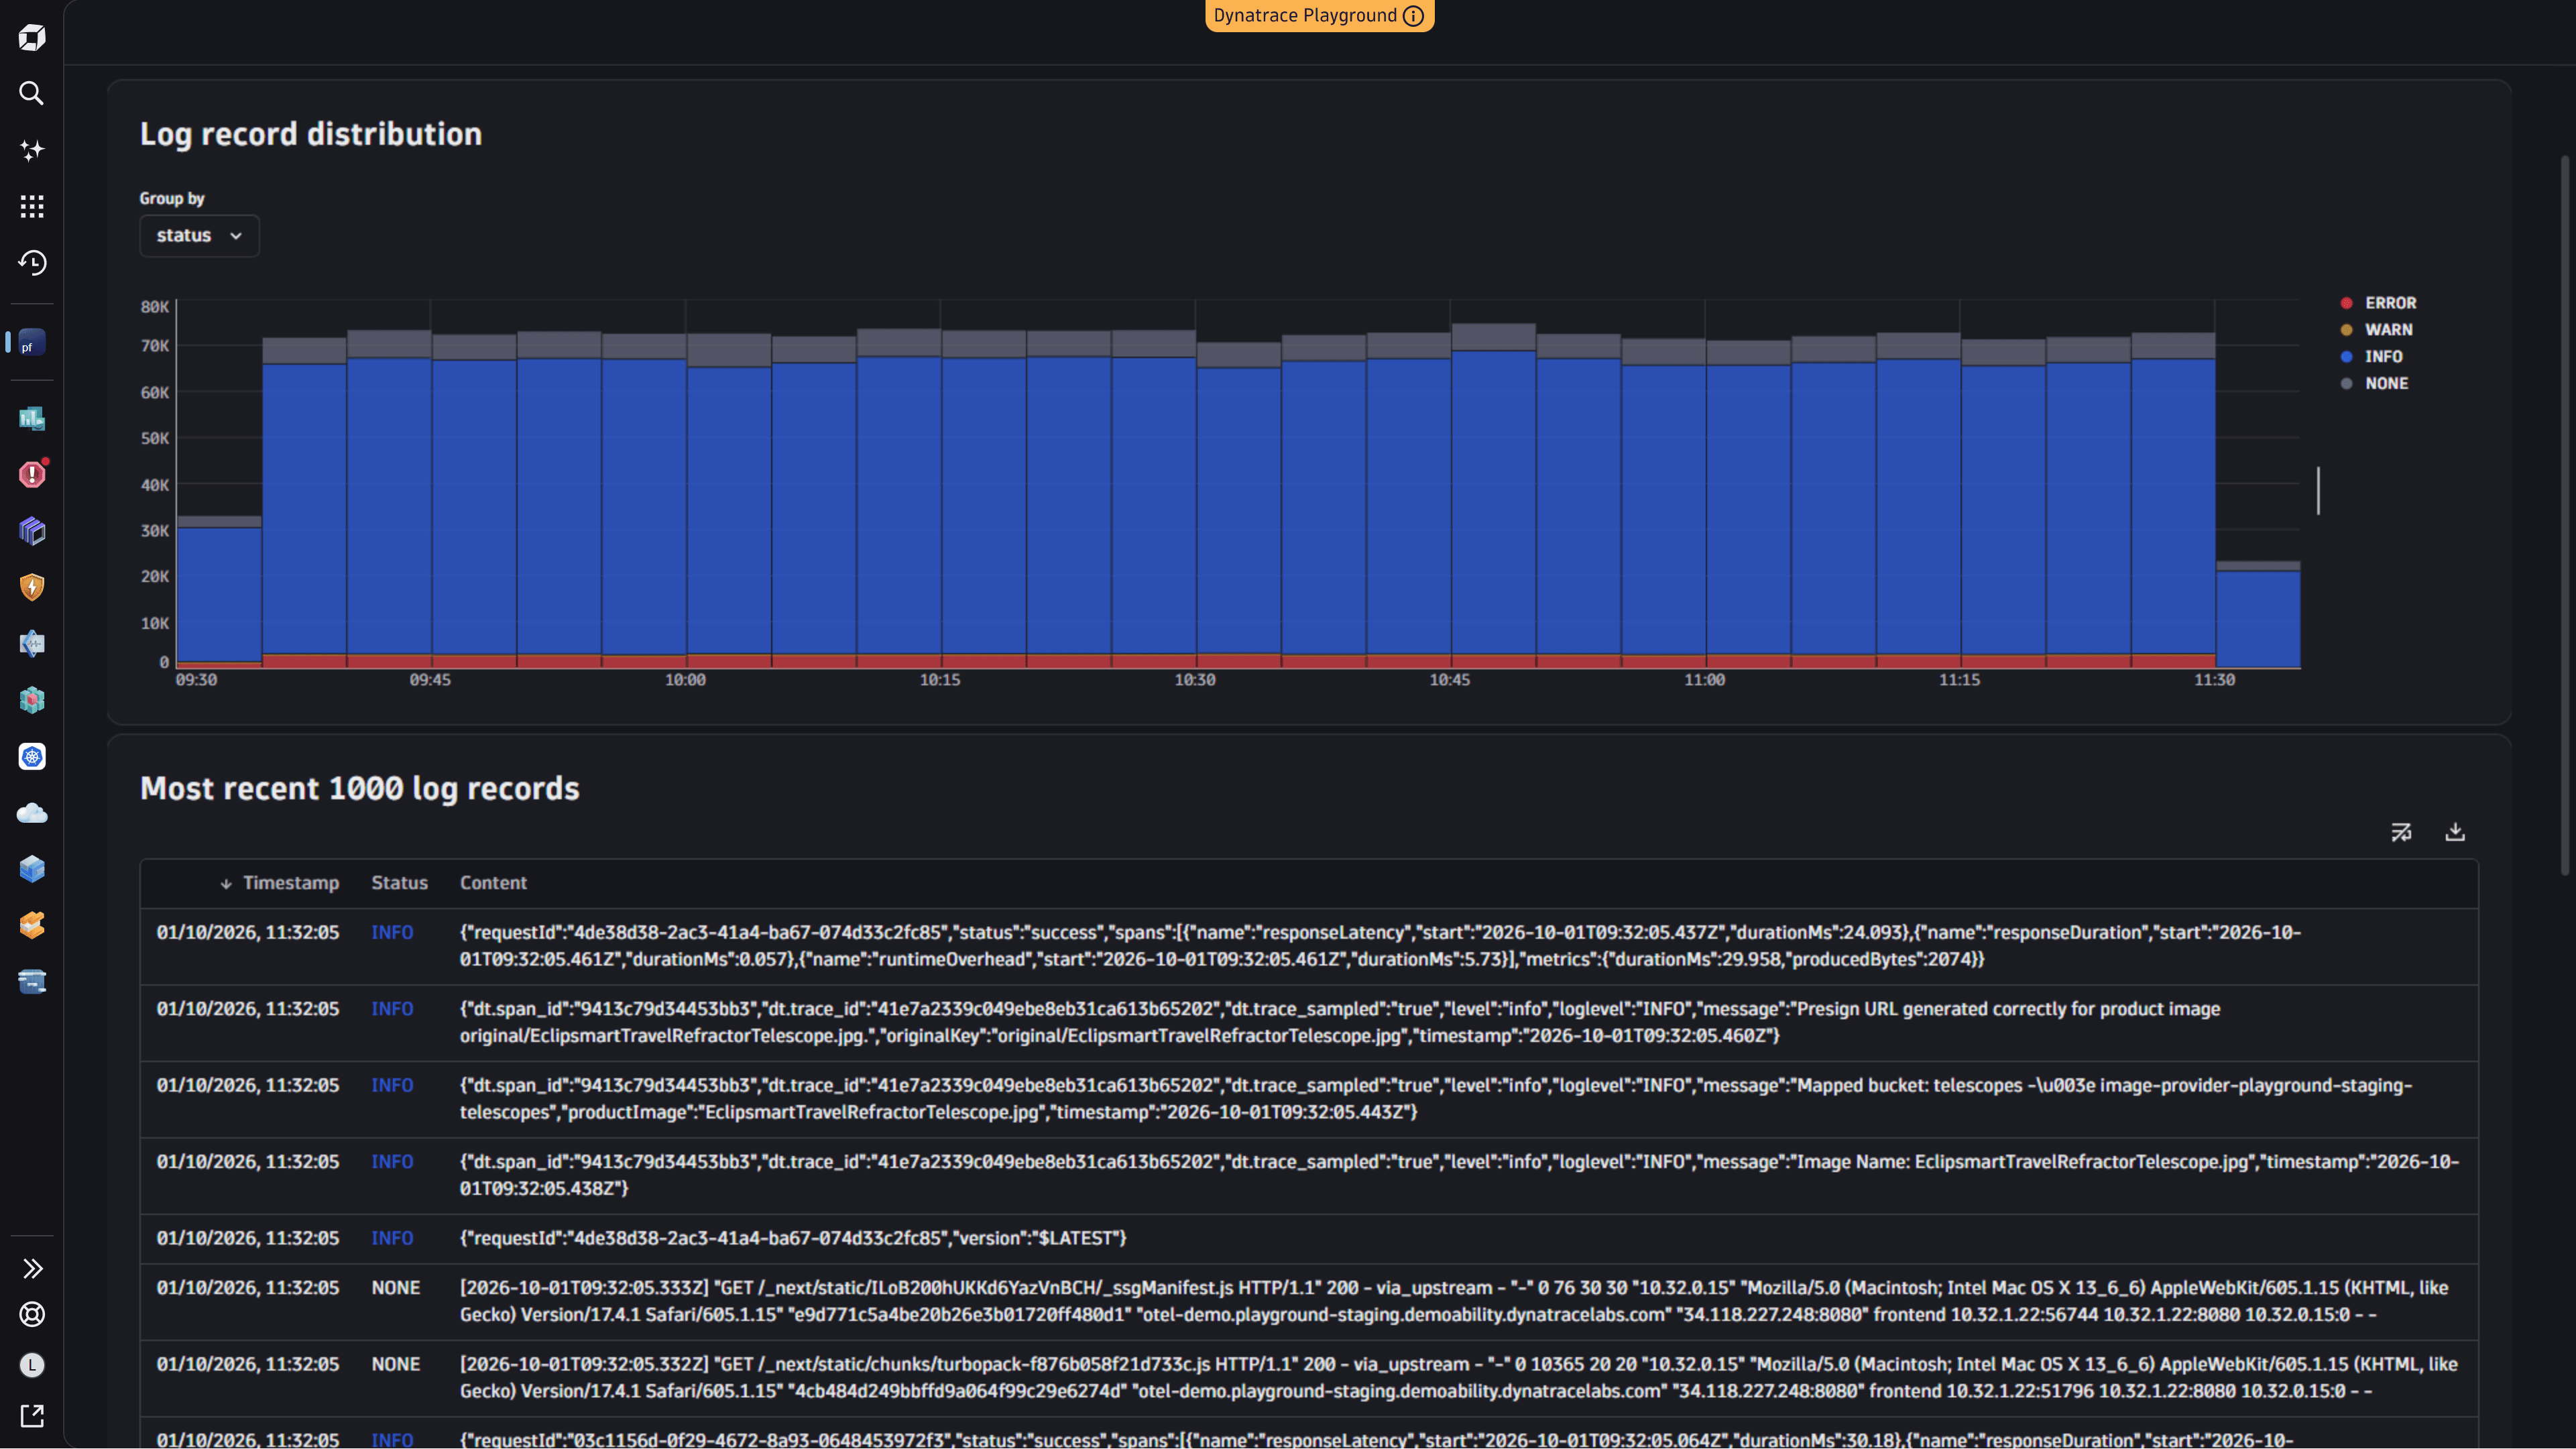
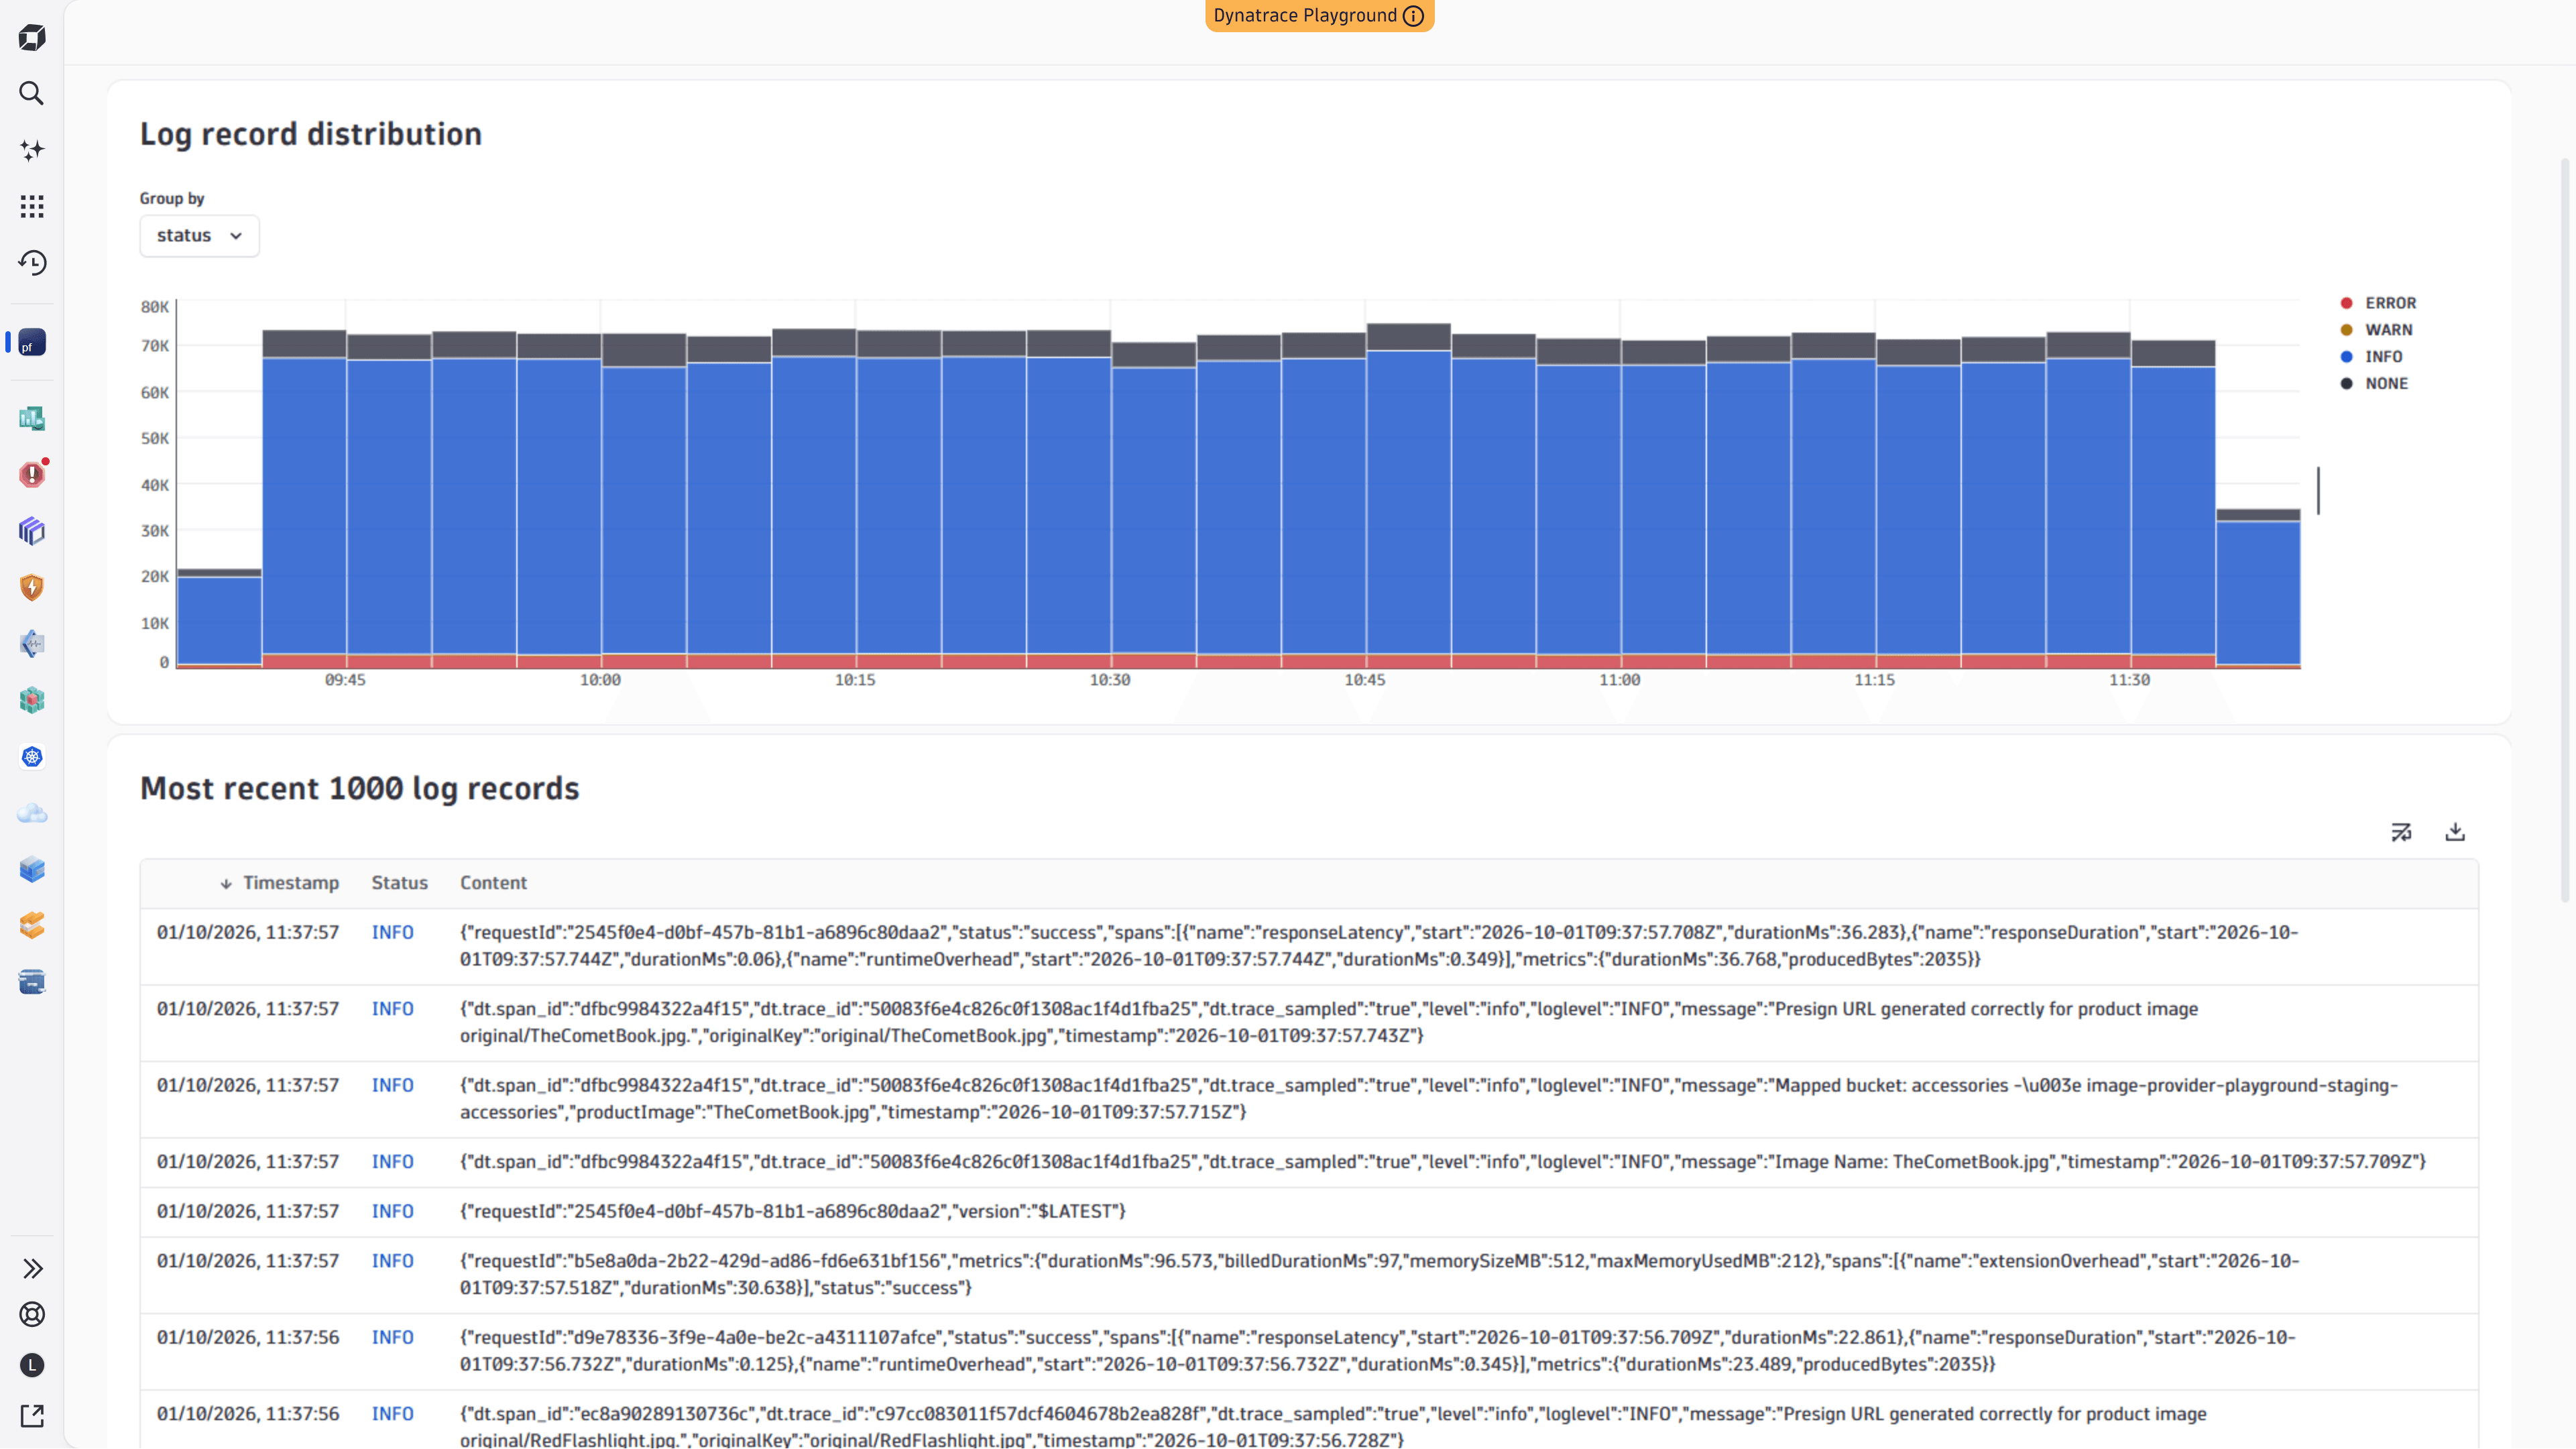
In the LogFieldDistribution component, we'll visualize how log records are distributed over time in a bar chart. Grouping by status is the obvious choice, and Strato ships a handy predefined log-status color palette for it. But the fields your logs carry depend on what your environment ingests, so instead of hardcoding one, we'll use the useGrailFields hook to discover the available fields, a Select to choose one, and the useDql hook to query whichever field the user picked.
useGrailFields requires two queries. autocompleteQueryOptions supplies the DQL fragment we want completions for, so fetch logs | fields returns the field names available on logs. The trailing space is required: the hook places the cursor at the end of the query string, so the space moves it past the fields token and the autocomplete suggests field names. Without the space, the suggestions complete the fields command instead and the dropdown stays empty. dssQueryOptions runs fieldsSnapshot logs; the hook returns no data until both queries finish, even though our select reads only the autocomplete response. select reduces those suggestions to the plain string[] the dropdown needs.
The query property of dssQueryOptions requires @dynatrace-sdk/react-hooks 1.14.0 or later.
The DQL query is now a function of the selected field. Using the makeTimeseries command, we can convert the raw log records to time series, grouped by that field. When a field is selected, we filter out records where that field is null before aggregating, so the chart reflects only records that carry it. When no field is selected, we omit the by: clause and chart a single total instead. We also add | limit 20, because a field can have a distinct value for nearly every log record, which produces far more series than a chart can usefully draw. limit takes an arbitrary 20 series rather than the biggest 20, so a high-cardinality field gives you a sample, not a ranking.
We need to also convert the DQL result to the appropriate type for the TimeseriesChart using the convertToTimeseries function. As we know, DQL doesn't guarantee any specific order in the results, so if we want a consistent and semantically valid visualization, we need to sort the time series data according to the status severity. The sort and the log-status palette only make sense when we group by status, so we apply both conditionally. The logSeries.data guard wraps only the chart, not the layout, so the dropdown stays visible while a newly selected field's query loads.
import React, { useState } from 'react';
import { TypedQueryResult, useDql, useGrailFields } from '@dynatrace-sdk/react-hooks';
import { FormField, Label, Select } from '@dynatrace/strato-components/forms';
import { Flex } from '@dynatrace/strato-components/layouts';
import { ProgressCircle } from '@dynatrace/strato-components/content';
import { Heading } from '@dynatrace/strato-components/typography';
import {
  convertToTimeseries,
  TimeseriesChart,
  type TimeseriesWithDimensions,
} from '@dynatrace/strato-components/charts';
import { Surface } from '@dynatrace/strato-components/layouts';

const buildQuery = (field: string | null) =>
  field
    ? `fetch logs
| filter isNotNull(${field})
| makeTimeseries count(), by:{${field}}, interval:5m
| limit 20`
    : `fetch logs
| makeTimeseries count(), interval:5m`;

const getSeriesName = (series: TimeseriesWithDimensions) => {
  return Array.isArray(series.name) ? series.name[0] : series.name;
};

const STATUS_ORDER = ['ERROR', 'WARN', 'INFO', 'NONE'];

const buildTimeseries = (result: TypedQueryResult, field: string | null) => {
  const timeseries = convertToTimeseries(result.records, result.types, undefined, result.metadata);
  if (field === 'status') {
    timeseries.sort((a, b) => STATUS_ORDER.indexOf(getSeriesName(a)) - STATUS_ORDER.indexOf(getSeriesName(b)));
  }

  return timeseries;
};

export const LogFieldDistribution = () => {
  const [selectedField, setSelectedField] = useState<string | null>(null);

  const { data: fieldNames } = useGrailFields({
    autocompleteQueryOptions: { query: 'fetch logs | fields ' },
    dssQueryOptions: { query: 'fieldsSnapshot logs' },
    select: ({ autocompleteData }) => (autocompleteData?.suggestions ?? []).map((s) => s.suggestion ?? ''),
  });

  const logSeries = useDql({
    query: buildQuery(selectedField),
  });

  return (
    <Surface>
      <Flex flexDirection="column" gap={24}>
        <Heading level={3}>Log record distribution</Heading>
        <FormField>
          <Label>Group by</Label>
          <Select value={selectedField} onChange={setSelectedField} clearable>
            <Select.Trigger placeholder="All log records" />
            <Select.Content>
              {fieldNames?.map((field) => (
                <Select.Option key={field} value={field}>
                  {field}
                </Select.Option>
              ))}
            </Select.Content>
          </Select>
        </FormField>
        {logSeries.isLoading && <ProgressCircle />}
        {logSeries.data && (
          <TimeseriesChart
            colorPalette={selectedField === 'status' ? 'log-status' : undefined}
            data={buildTimeseries(logSeries.data, selectedField)}
            variant="bar"
          />
        )}
      </Flex>
    </Surface>
  );
};
This operation requires the following scopes:
storage:buckets:readstorage:logs:read
The LogRecords component
The LogRecords component consists of a table with the latest logs generated in our environment. Similar to how we did it in the LogFieldDistribution component, we'll use DQL and the useDql hook, but we'll use the DataTable component for the visualization.
The DQL part is relatively simple. We use the fields command to retrieve only those values that interest us. Then we sort them by timestamp. The DataTable component understands the DQL response format in this case, so no conversion is needed.
The DataTable component is highly customizable. For our use case, we'll configure different colors for the log status using thresholds and color tokens to give instant visual feedback and communicate the severity. We'll also add a toolbar with useful actions, the ability to sort the table, and pagination.
import React from 'react';
import { useDql } from '@dynatrace-sdk/react-hooks';
import { ResultRecord } from '@dynatrace-sdk/client-query';
import { ProgressCircle } from '@dynatrace/strato-components/content';
import { Heading } from '@dynatrace/strato-components/typography';
import { DataTable, DataTableColumnDef } from '@dynatrace/strato-components/tables';
import { Surface } from '@dynatrace/strato-components/layouts';
import Colors from '@dynatrace/strato-design-tokens/colors';

const LOG_RECORDS_QUERY = `fetch logs
| fields timestamp, status, content
| sort timestamp desc`;

const columns: DataTableColumnDef<ResultRecord>[] = [
  {
    header: 'Timestamp',
    id: 'timestamp',
    accessor: 'timestamp',
    width: 'content',
    columnType: 'date',
  },
  {
    header: 'Status',
    id: 'status',
    accessor: 'status',
    width: 'content',

    thresholds: [
      {
        value: 'INFO',
        comparator: 'equal-to',
        color: Colors.Charts.Logstatus.Info.Default,
      },
      {
        value: 'WARN',
        comparator: 'equal-to',
        color: Colors.Charts.Logstatus.Warning.Default,
      },
      {
        value: 'ERROR',
        comparator: 'equal-to',
        color: Colors.Charts.Logstatus.Error.Default,
      },
    ],
  },
  {
    header: 'Content',
    id: 'content',
    accessor: 'content',
  },
];

export const LogRecords = () => {
  const logRecords = useDql({
    query: LOG_RECORDS_QUERY,
  });

  return (
    <Surface>
      {logRecords.isLoading && <ProgressCircle />}
      {logRecords.data && (
        <>
          <Heading level={3}>Most recent {logRecords.data.records.length} log records</Heading>
          <DataTable
            sortable
            defaultSortBy={[{ id: 'timestamp', desc: true }]}
            data={logRecords.data.records}
            columns={columns}
            lineWrap
            fullWidth
          >
            <DataTable.Toolbar>
              <DataTable.DownloadData />
              <DataTable.LineWrap />
            </DataTable.Toolbar>
            <DataTable.Pagination defaultPageSize={20} />
          </DataTable>
        </>
      )}
    </Surface>
  );
};
Putting it together
The last piece of the puzzle is using these components somewhere. We can simply instantiate them in the App component, and we're done.
import React from 'react';
import { Heading } from '@dynatrace/strato-components/typography';
import { Flex } from '@dynatrace/strato-components/layouts';
import { PageLayout } from '@dynatrace/strato-components/layouts';
import { AppHeader } from '@dynatrace/strato-components/layouts';
import { LogFieldDistribution } from './components/LogFieldDistribution';
import { LogRecords } from './components/LogRecords';

export const App = () => {
  return (
    <PageLayout>
      <PageLayout.Header>
        <AppHeader />
      </PageLayout.Header>
      <PageLayout.Content>
        <Flex padding={16} flexDirection="column">
          <Heading level={2}>Logs Viewer</Heading>
          <LogFieldDistribution />
          <LogRecords />
        </Flex>
      </PageLayout.Content>
    </PageLayout>
  );
};
Summary
Just like that, we've created a basic logs viewer app in no time, with a chart you can regroup by any field your logs carry and a table of the most recent records. We hope you found this guide helpful and got the inspiration to build more Dynatrace Apps.