Access Dynatrace data
- Tutorial
- 5 minutes
In this section, we'll do the following:
- Query metrics for all hosts using Dynatrace Query Language (DQL)
- We'll also show this data in a table using the Strato design system
1. Create our first component
First, open the host-insights directory in your preferred code editor. You'll notice a fair amount of code. It's all generated by the Dynatrace App Toolkit.
Create a new file called HostList.tsx in ui/app/pages. It will be the main component of the app. As a starting point, copy the following code into the HostList.tsx file:
import React from 'react';
import { Flex } from '@dynatrace/strato-components/layouts';
import { TitleBar } from '@dynatrace/strato-components-preview/layouts';

export const HostList = () => {
  return (
    <Flex width="100%" flexDirection="column" justifyContent="center" gap={16}>
      <TitleBar>
        <TitleBar.Title>Hosts Insights</TitleBar.Title>
      </TitleBar>
    </Flex>
  );
};
Next, update ui/app/App.tsx to include the HostList component and adapt the app header like the following:
import {
  Page,
  AppHeader,
} from '@dynatrace/strato-components-preview/layouts';
import React from 'react';
import {
  Route,
  Routes,
  Link,
} from 'react-router-dom';
import { HostList } from './pages/HostList';

export const App = () => {
  return (
    <Page>
      <Page.Header>
        <AppHeader>
          <AppHeader.NavItems>
            <AppHeader.AppNavLink as={Link} to="/" />
          </AppHeader.NavItems>
        </AppHeader>
      </Page.Header>
      <Page.Main>
        <Routes>
          <Route path="/" element={<HostList />} />
        </Routes>
      </Page.Main>
    </Page>
  );
};
After saving all the files, you should see the title bar from the HostList component in the browser.
2. Query and visualize data
Now, we can query and display the CPU information in the HostList component.
1. Set the permissions
First, set the permissions in the app config file that the app needs to work. In this case, the app requires access to metrics and entities. Add the necessary permissions in the app.config.json file as follows:
{
  "environmentUrl": "https://wkf10640.apps.dynatrace.com/",
  "app": {
    "name": "Host Insights",
    "version": "0.0.0",
    "description": "A starting project with routing, fetching data, and charting",
    "id": "my.host.insights",
    "scopes": [
      { "name": "storage:logs:read", "comment": "default template" },
      { "name": "storage:buckets:read", "comment": "default template" },
      { "name": "storage:metrics:read", "comment": "Allows to read metrics" },
      { "name": "storage:entities:read", "comment": "Allows to read entities" }
    ]
  }
}
For changes in the config file to take effect, restart the development server using the appropriate command for your operating system. For example, on Windows, you can press Ctrl + C in the terminal where the server is running. Then, run the npx dt-app dev command.
2. Query the data
Now, create a new file, ui/app/queries.ts, which exports the DQL query we'll use to fetch the data, as follows:
export const CPU_USAGE_QUERY = `timeseries cpuAvg = avg(dt.host.cpu.usage), by:{dt.entity.host, host.name}
| fieldsRename hostId = dt.entity.host, hostName = host.name
| lookup [
  timeseries {
    idle=avg(dt.host.cpu.idle),
    ioWait=avg(dt.host.cpu.iowait),
    user=avg(dt.host.cpu.user),
    system=avg(dt.host.cpu.system),
    steal=avg(dt.host.cpu.steal)
  },
  by:{dt.entity.host}
  | fieldsAdd idle = arrayAvg(idle), ioWait = arrayAvg(ioWait), user = arrayAvg(user), system = arrayAvg(system), steal = arrayAvg(steal)
  | fieldsAdd other = 100 - idle - ioWait - user - system - steal
], sourceField:hostId, lookupField:dt.entity.host, fields:{idle, ioWait, user, system, steal, other}`;
Run this query in Notebooks.
Next, import the query in the HostList file and fetch that data with useDqlQuery. To use the hook, import it and call it in the HostList component. Then, pass the CPU_USAGE_QUERY from before as the query property of the body and assign the result to a result variable, as follows:
import React from 'react';
import { Flex } from '@dynatrace/strato-components/layouts';
import { TitleBar } from '@dynatrace/strato-components-preview/layouts';
import { useDqlQuery } from '@dynatrace-sdk/react-hooks';
import { CPU_USAGE_QUERY } from '../queries';

export const HostList = () => {
  const result = useDqlQuery({
    body: {
      query: CPU_USAGE_QUERY,
    },
  });

  return (
    <Flex width="100%" flexDirection="column" justifyContent="center" gap={16}>
      <TitleBar>
        <TitleBar.Title>Hosts Insights</TitleBar.Title>
      </TitleBar>
    </Flex>
  );
};
You might see an IDE warning such as: "result is assigned a value but never used." You can dismiss it since we'll use the result variable in the next step.
The result variable has all the information about the loading or error states of the query and the data itself after loading. If you open the browser's Network tab, you'll notice that an HTTP request is sent to Grail to fetch the data.
3. Show the data in a table
We're now ready to visualize this data in the UI.
Begin by importing the DataTableV2 component and the convertToColumnsV2 function from the @dynatrace/strato-components-preview package. The query result isn't available when the component first loads. Therefore, we need to conditionally render the DataTableV2 only when the data is ready. The DataTableV2 component requires two props: data, for which we'll use result.data.records, and columns, which we obtain by calling convertToColumnsV2(result.data.types).
Here's the complete code:
import React from 'react';
import { Flex } from '@dynatrace/strato-components/layouts';
import { TitleBar } from '@dynatrace/strato-components-preview/layouts';
import {
  convertToColumnsV2,
} from '@dynatrace/strato-components-preview/conversion-utilities';
import {
  DataTableV2,
} from '@dynatrace/strato-components-preview/tables';
import { useDqlQuery } from '@dynatrace-sdk/react-hooks';
import { CPU_USAGE_QUERY } from '../queries';

export const HostList = () => {
  const result = useDqlQuery({
    body: {
      query: CPU_USAGE_QUERY,
    },
  });

  return (
    <Flex width="100%" flexDirection="column" justifyContent="center" gap={16}>
      <TitleBar>
        <TitleBar.Title>Hosts Insights</TitleBar.Title>
      </TitleBar>
      {result.data && (
        <DataTableV2 data={result.data.records} columns={convertToColumnsV2(result.data.types)} fullWidth>
        </DataTableV2>
      )}
    </Flex>
  );
};
After the development server reloads, you should see something like this:
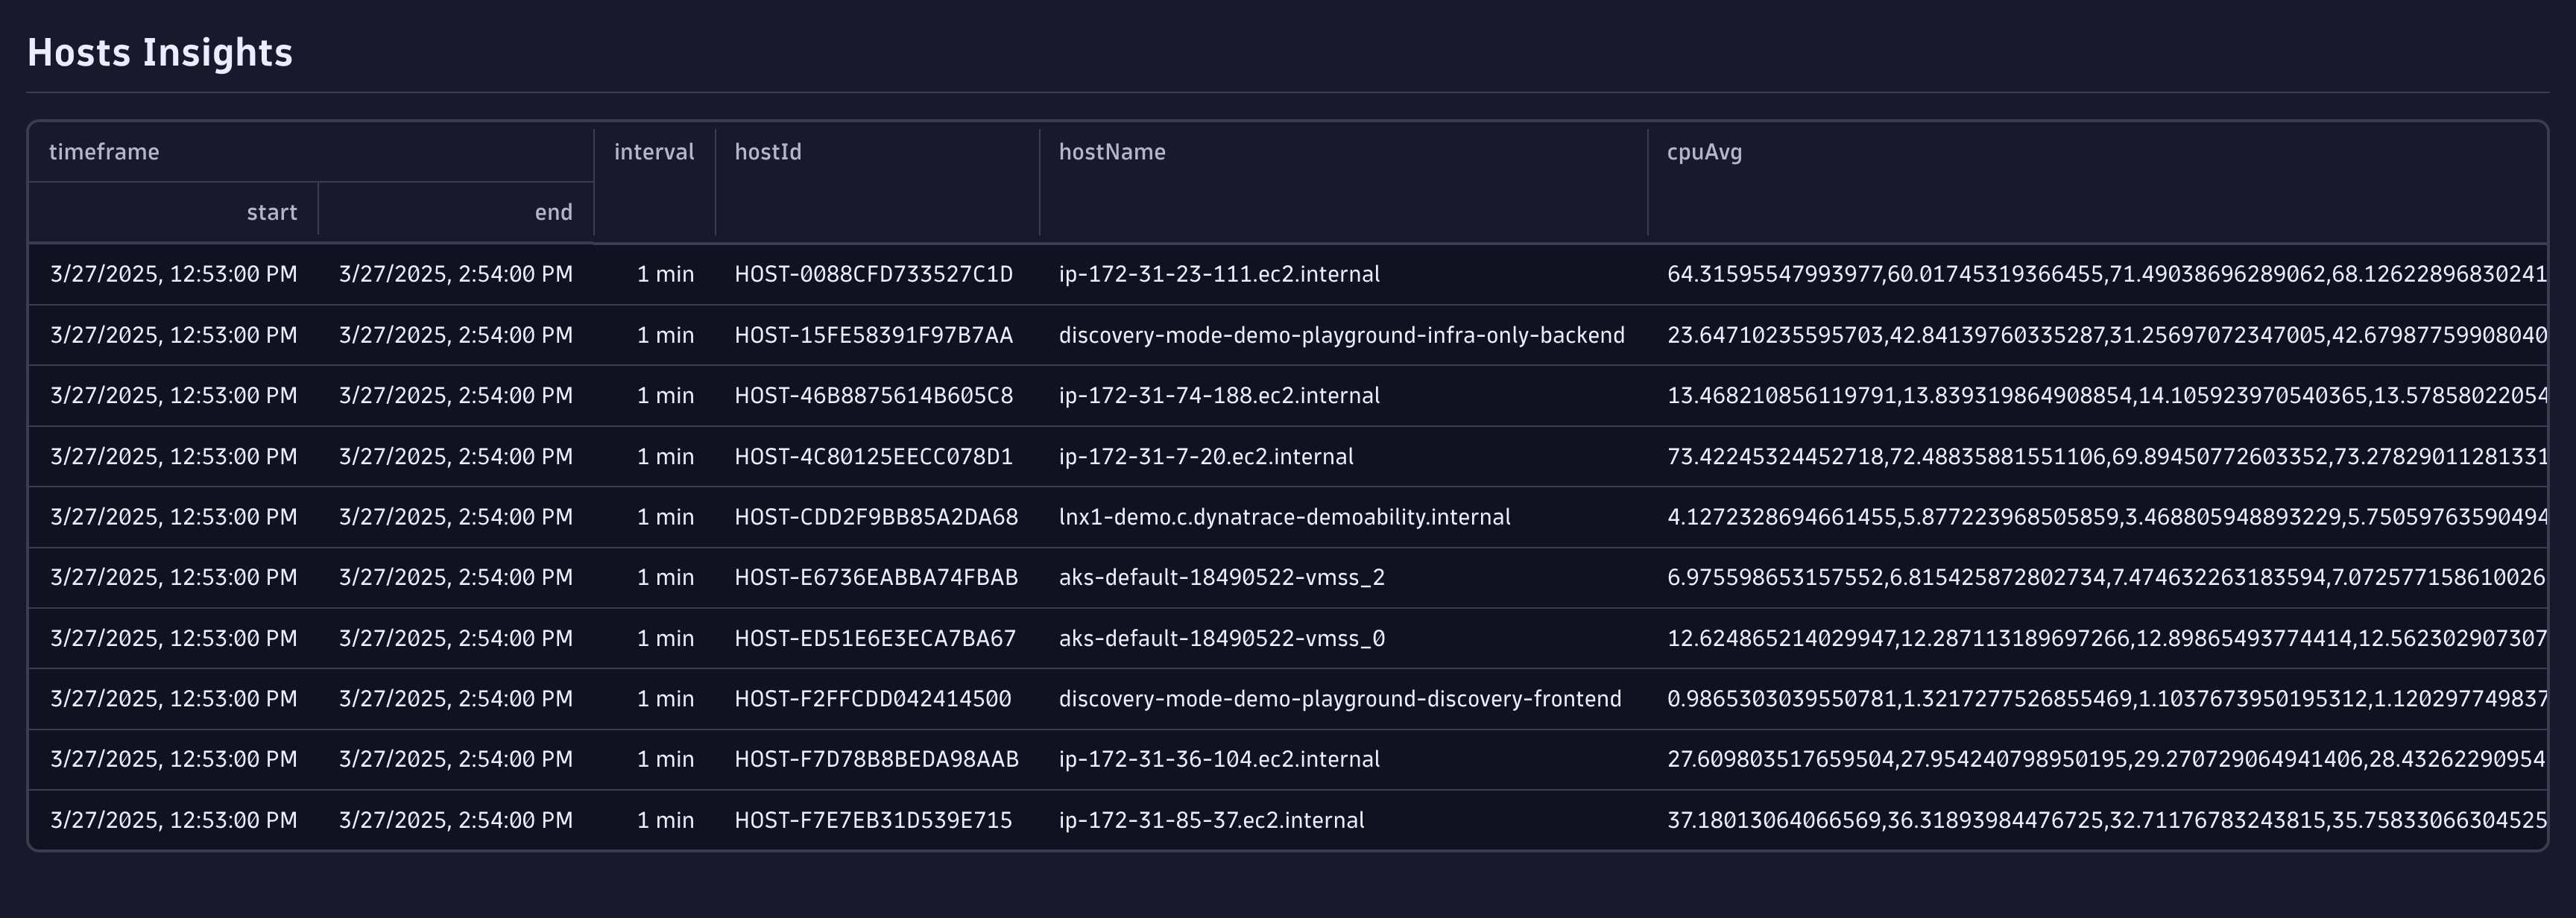
You've queried Grail using DQL and showed it in a table. In the next section, we'll improve this visualization for a better user experience.