JMX extensions
- How to
- 4 minutes
The Extensions Framework 2.0 for JMX has been available since version 1.213 and brings you new possibilities for visualizing and querying your data. Follow this guide to learn how to leverage Visual Studio Code to convert your 1.0 extensions to the new format automatically.
Prerequisites
-
Complete the first-time setup for your editor
For simplicity, this guide will assume you have already configured your editor for first-time use. If you haven't used Dynatrace Extensions for VS Code before, follow our Getting started guide to complete your first-time setup.
NoteThis guide will assume you have access to developer credentials. If you followed the "Getting started" guide, store the generated credentials in VS Code's global settings - an example is shown here
-
Enable JMX 2.0 extensions in your environment
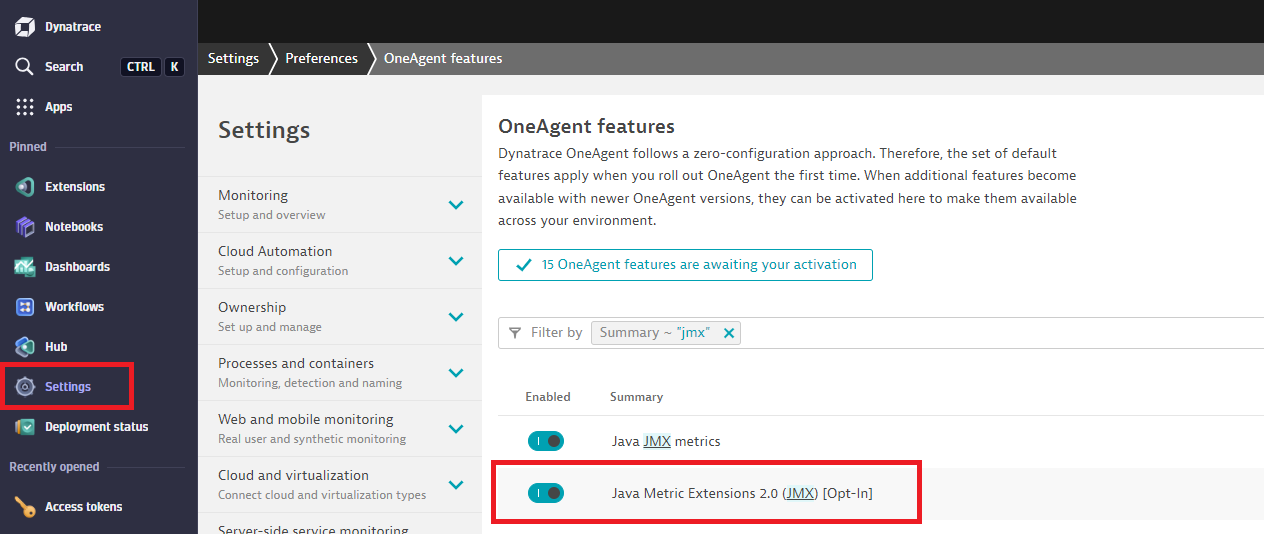
Go to Settings > Preferences > OneAgent features and enable Java Metric Extensions 2.0 (JMX), then restart your monitored Java processes.

Convert a JMX Extension as a new project
Initialize your workspace
-
Create a new folder on your computer and open it in VS Code.
-
Press F1 then select the command Dynatrace extensions: Initialize workspace
-
Next, choose schema version 1.275.0 from the list
-
When prompted about certificates, choose Use existing

-
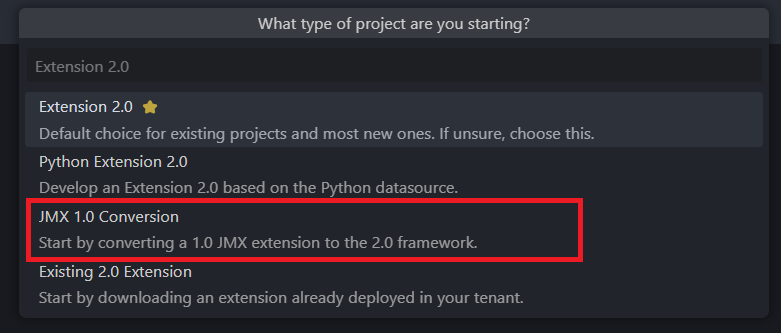
When prompted about project type, choose JMX 1.0 Conversion

Your workspace has been initialized, and you're ready to convert your old extension.
Convert your extension
-
You need to load the JMX 1.0 Extension for conversion. You can browse your local filesystem for a
.ziporplugin.jsonfile or browse your connected Dynatrace environment. As part of this guide, we'll do the latter. Choose to load it Remotely:
-
You are now presented with a list of extensions from your tenant. Choose which one you want to convert. For example:
 Note
NoteAfter selecting an extension, you may be prompted for a new extension name if your old one is too long.
-
Next, you should select a technology so that Process pages can be configured automatically. Choose one that applies to your Java process. Otherwise, choose All other

-
Optionally, we can also show the data on your Host's page. To follow along with this guide, select Yes
The conversion will generate your new extension manifest at extension/extension.yaml.
Convert a JMX Extension standalone
If you don't want to initialize a new workspace for your project or you're already working within a registered workspace, you can run our automation as a standalone command.
Press F1 and select the command Dynatrace Extensions: Convert JMX. This workflow starts by first prompting you to load the extension and follows the same steps as mentioned above.
At the end, your new manifest will be placed in extension/extension.yaml, or you'll be prompted for a save destination if this folder doesn't exist in the currently opened workspace.
Deploy and configure your new extension
Build and upload to Dynatrace
-
Build the extension by pressing F1 then clicking the command Dynatrace extensions: Build
-
Then, choose to upload it to Dynatrace by clicking Yes

-
Next, activate this extension by clicking Yes

Add a monitoring configuration
- Open your extension either from the prompt or from the Extensions menu in Dynatrace
- Add a monitoring configuration by clicking the button

- Select a Host running your Java process, then click Next step.

- On the next page click Next step once again, then add a description and click Activate.
Once your monitoring configuration is activated, data collection starts automatically.
Find your extension's data
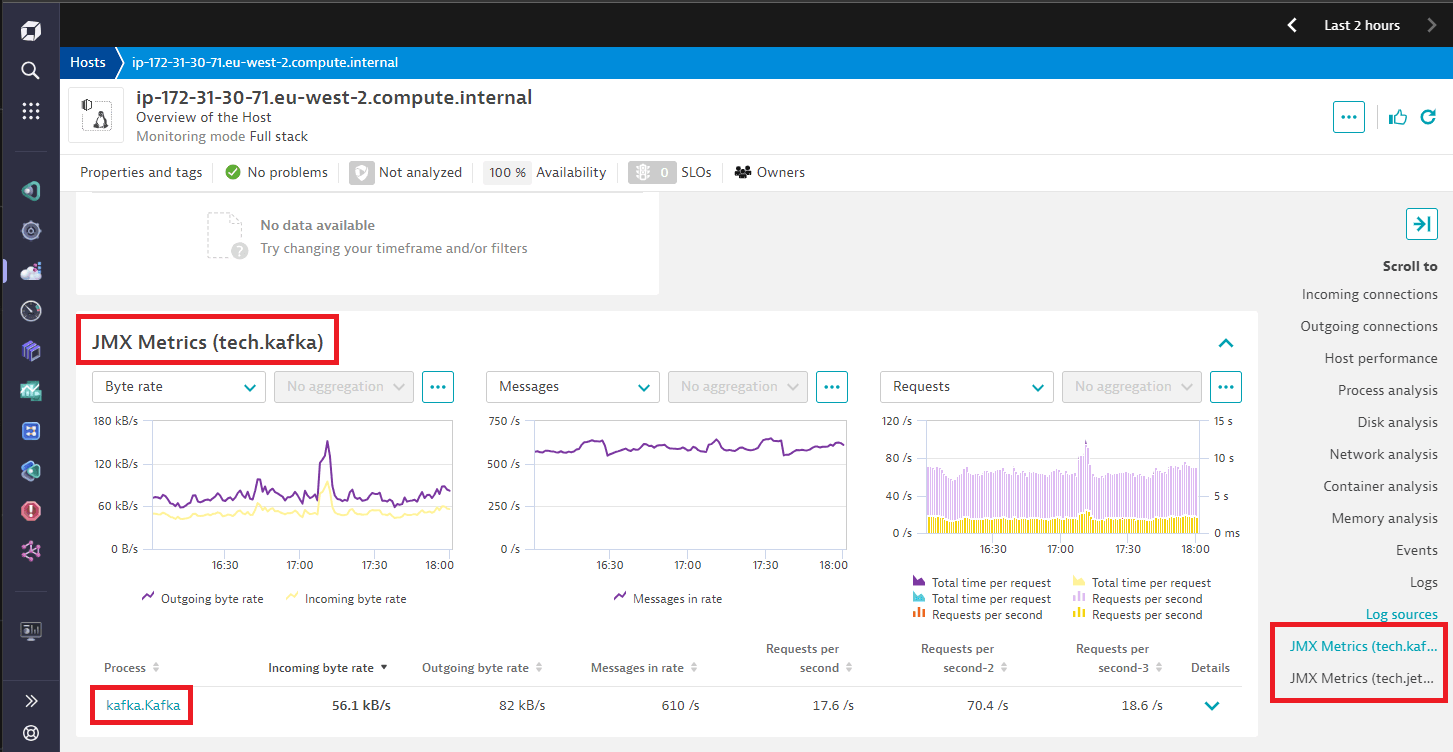
Open the details page of one of the hosts running your monitored Java process. You should see a card (towards the bottom) with a title starting with JMX Metrics.

From that card, select any of the processes listed. Then click ... and choose Metrics and logs analysis.

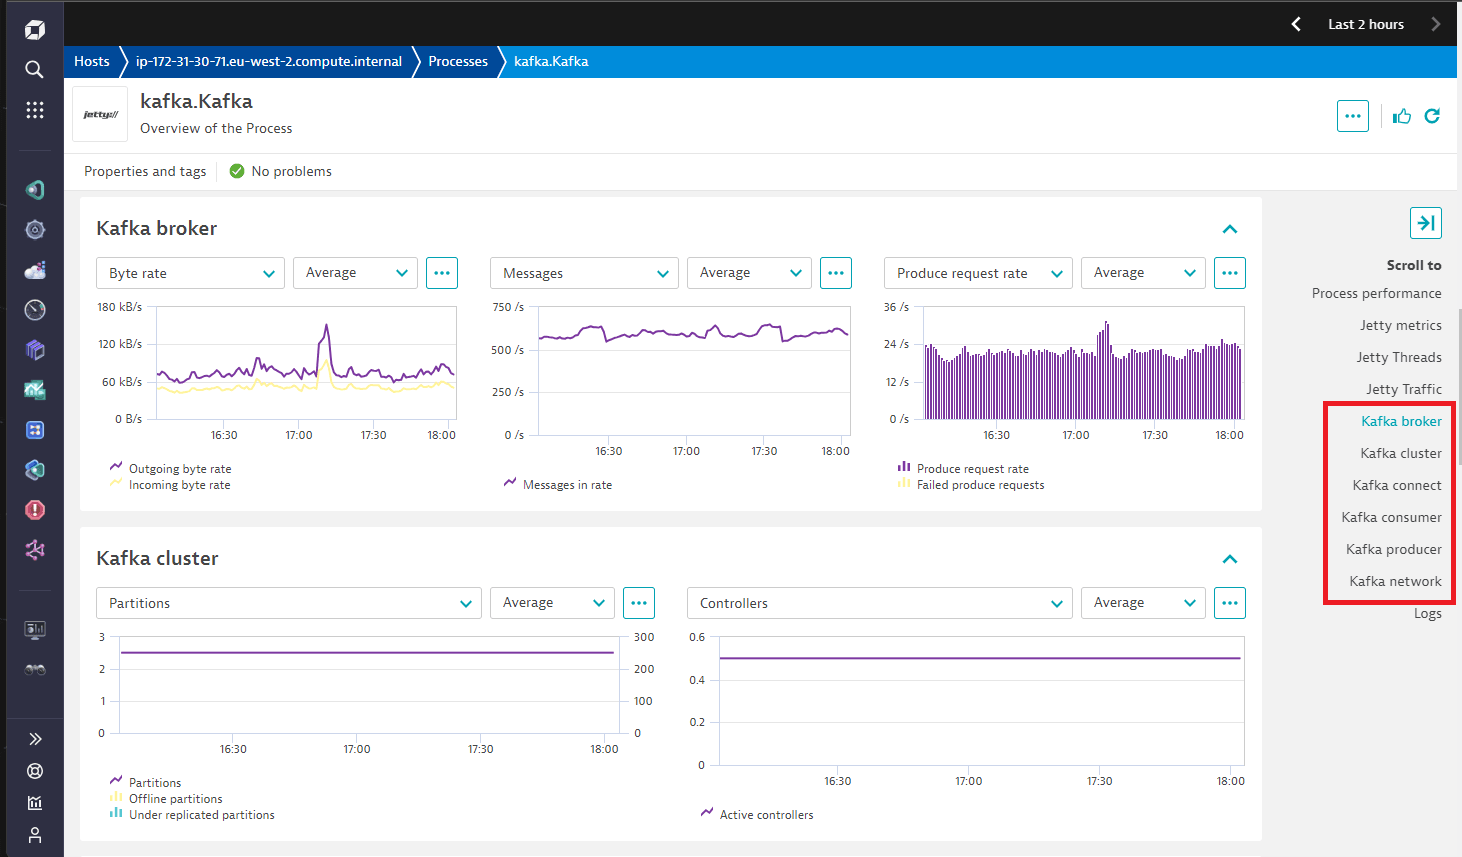
On the page that opens, you'll have multiple cards from your extension.

The cards on the Process page are only added if you selected a technology during the conversion.