Debug apps
- Concept
- 5 minutes
Dynatrace Apps are React apps. You can debug the problems with different tools like:
- Browser developer tools
- Visual Studio Code
Debugging in Browser
Most browsers offer developer tools that help you to debug your web applications. Although, browsers might have different UIs for developer tools, they provide similar functionalities.
To open the developers tools, use Ctrl + Shift + I (on Windows) or Ctrl + Option + I (on Mac). This is how it looks in Chrome:
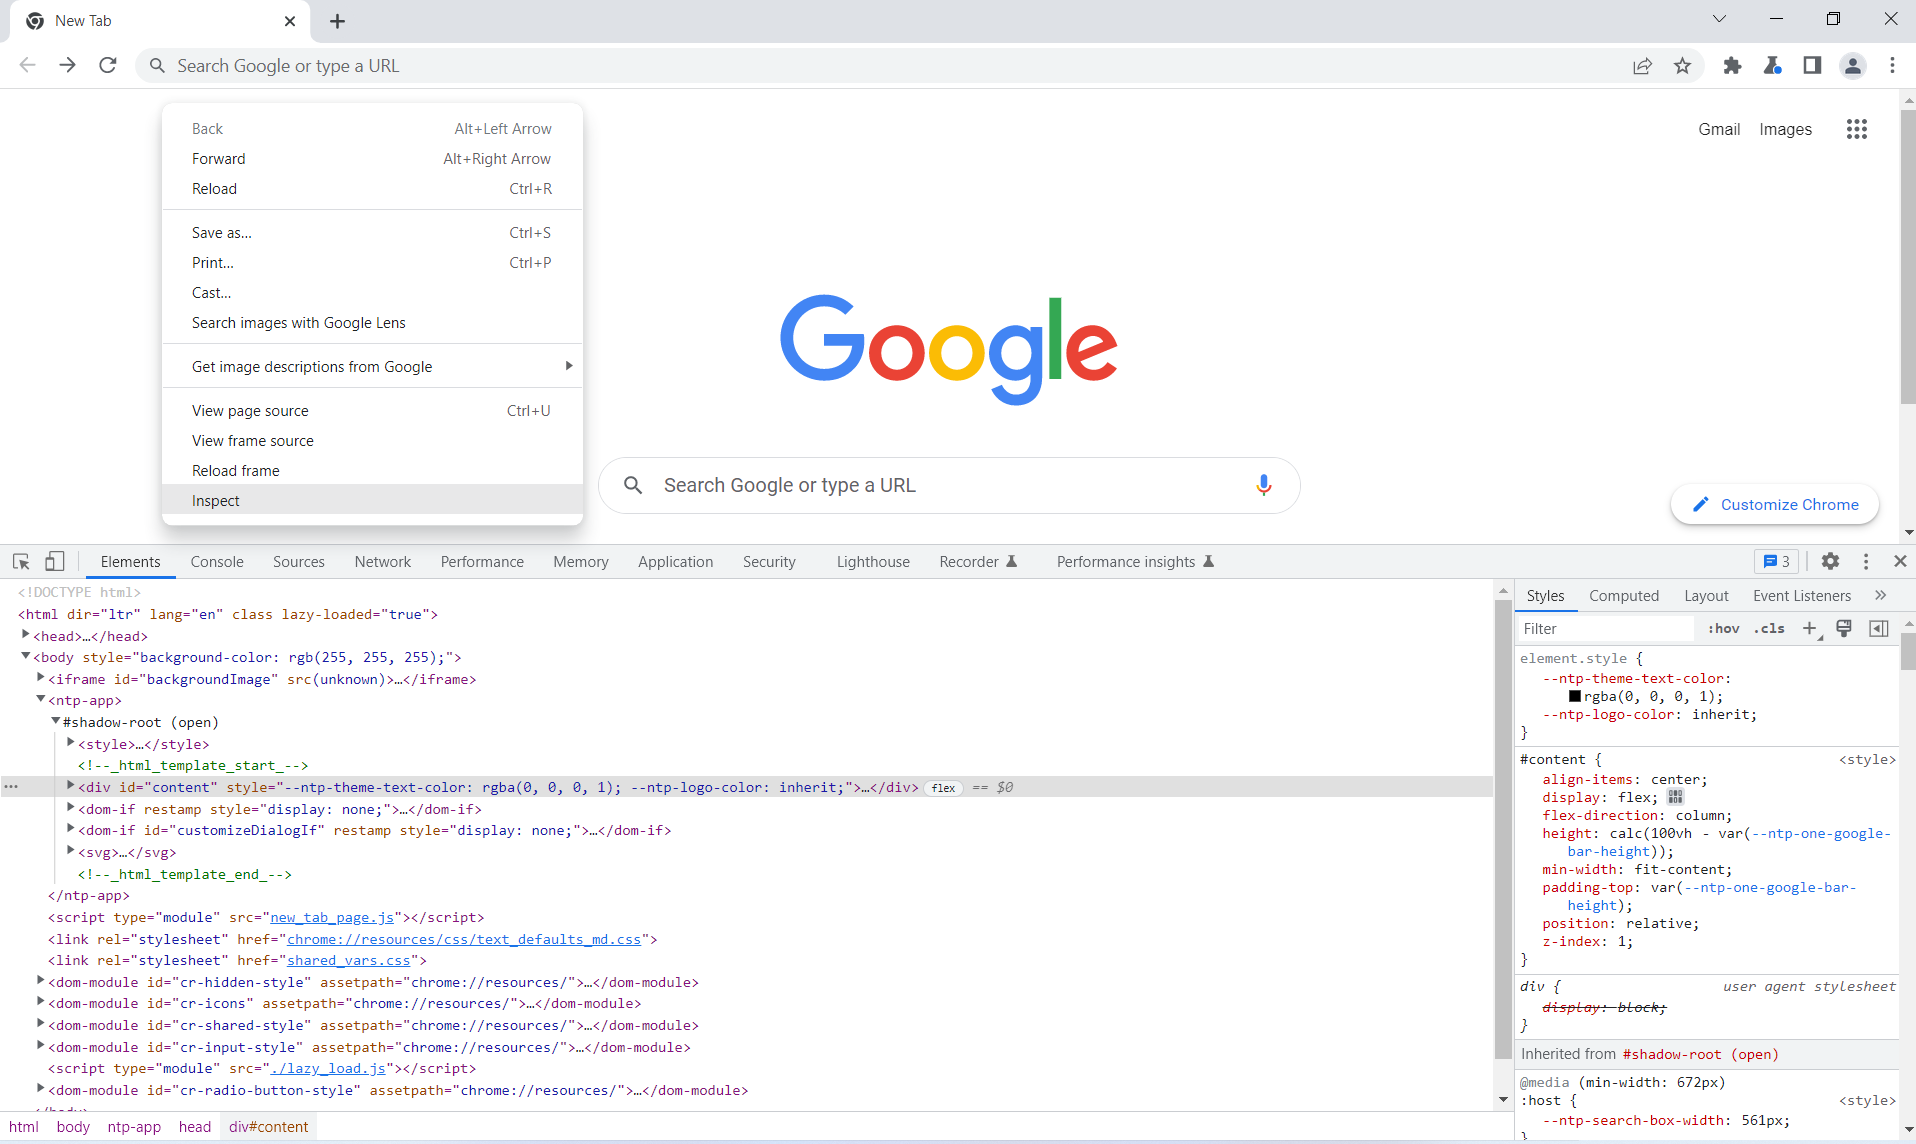
Debugging UI
The developer tools provide an Elements (Chrome) or an Inspector(Firefox) tab to debug visual issues. You can do the following with the Elements tab:
- View and change the DOM elements
- View and change the CSS
- Inspect the CSS Grid
- Debug CSS Flexbox layouts
To know more about it, take a look at Elements docs.
Debugging JavaScript
There are various options to debug your JavaScript application.
- The
console.log: The ubiquitousconsole.logcomes very handy in debugging JavaScript. You can see all the logs in theConsoletab of the developer tools. It might sound primitive, but it gets work done. - The
debuggerstatement: You can also write adebuggerstatement within your code, just likeconsole.log. The debugger statement pauses the execution of the code like a breakpoint. To know more, take a look at debugger statement docs. - Debugger: Chrome and Firefox provide a debugger under the
SourcesorDebuggertab. The debugger allows you to set breakpoints, start and pause the code execution, check the call stack, and a lot more. To know more, read the debugger documentation.
Debugging Network requests
Sometimes you might want to see what kind of response you get from a server. The developer tools have a Network tab to do it. It allows you to do the following:
- Inspect network activity
- Block requests
- Simulate network connection
- Check the request's timing
- Record network requests
To know more, read the Network documentation.
To learn more about Developer tools, read the Chrome documentation or Firefox documentation.
Debugging with React Developer Tools
React Developer Tools is a browser extension that allows you to inspect the React component hierarchies using your browser's developer tools. It's available for Chrome, Firefox, and Microsoft Edge.
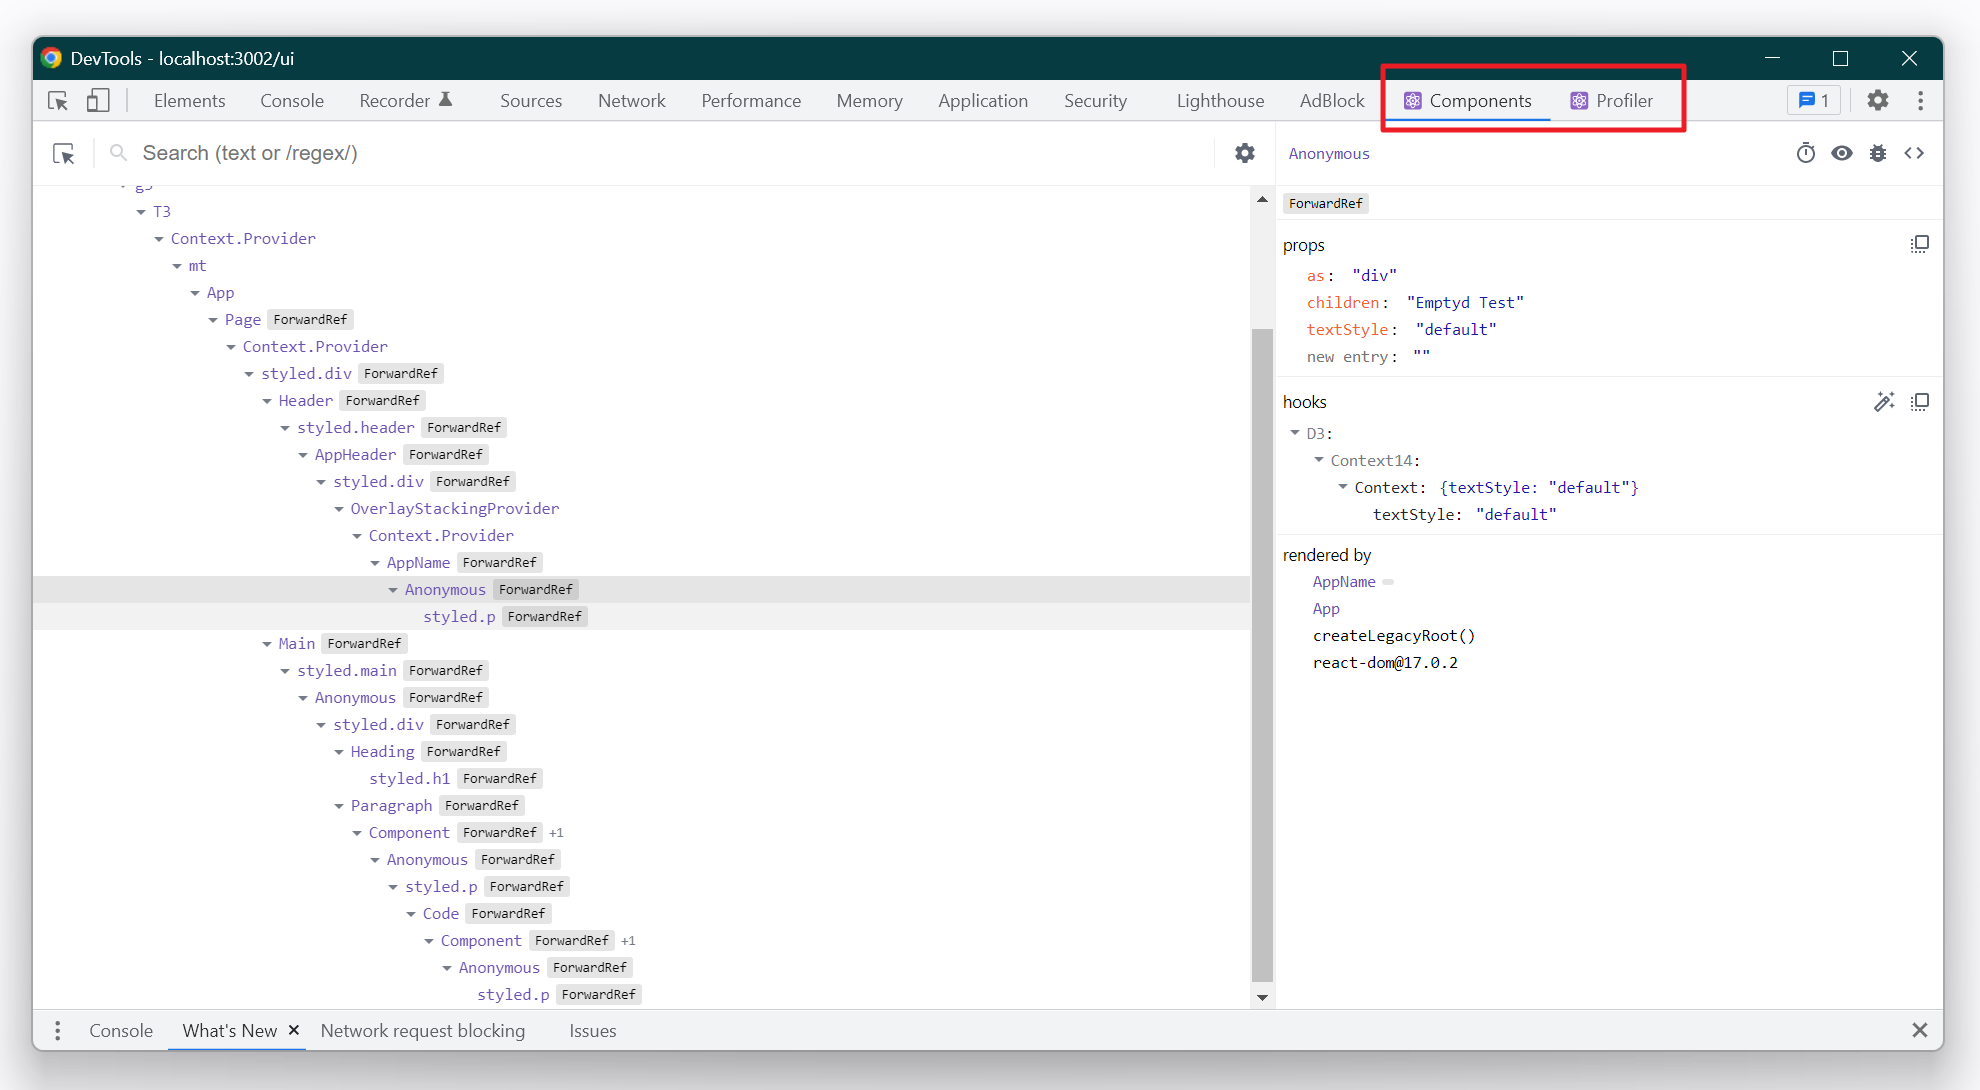
After adding the extension, you get two extra tabs in the browser's developer tools: The Components and the Profiler tabs.
The app shell renders apps in an iframe. The React developer tools won't work correctly for an iframe. Therefore, you need to detach the apps from the app shell. Read the app shell documentation to know more.
Debugging the Component tree
The Components tab shows you the React component hierarchy. It lets you see and manipulate component state and props. This is how it looks in Chrome:
Debugging the performance
The Profiler tabs allow you to profile your react application. It's something very similar to the developer tools's Performance tab but specific to React. Follow these steps to use the profile:
- Start recording the session by clicking the red circle
- Do the operation in your React application.(For example: click a button, input some text)
- Press the circle again to finish the session. You'd see the component-specific timings as a result.
To know more about React Developer tools, read this tutorial on How To Debug React Components Using React Developer Tools.
Debugging with VSCode
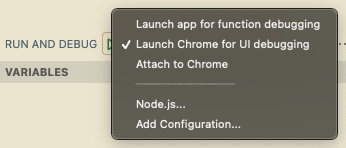
Projects generated with the Dynatrace App Toolkit include launch configurations for debugging apps with Visual Studio Code. To get started, open the Run and Debug tab on the left bar, then select the configuration you want to use:
Next, select the Run button to start debugging. To see the output of the Dynatrace App Toolkit, select Debug Console in the bottom pane.
Debugging the UI
To debug UI code from within Visual Studio Code, use the Launch Chrome for UI debugging configuration. This configuration will start the development server with the Dynatrace App Toolkit and once it's ready, launch Google Chrome. Now you can set breakpoints within the UI source code and reload the page if required.
Troubleshooting
If a breakpoint isn't recognized, try removing and adding it again. In cases where breakpoints aren't triggered during app startup, detach the app from the App Shell with the Detach button on the bottom left and reload the page.
Tips
Following are some tips that might help you while debugging:
- Read the error: Many times developers ignore the error provided by libraries. Take a pause, and read the error. Your solution might be already mentioned.
- Use your editor: Since Dynatrace Apps use TypeScript, your editor might be able to help you in correcting some syntactic issues. Take a look at the TypeScript page to know how it can help you.
- Ask others: Sometimes it's difficult to debug the code you write. Ask your fellow teammate to take a look at your code.
- Share with the community: There is a possibility that your issue is a bug in the underline tooling. In that case, create an issue ticket for the respective team, or send a slack message to the appropriate group.