Monitor Dynatrace apps
- How to
- 3 minutes
This guide will show you how to set up monitoring in your Dynatrace App. Currently, there are two ways in which apps can self-monitor: Real User Monitoring (RUM) collects data about users' interaction with the app, while App Function Logs provide you with information about errors and log data in your app.
Prioritizing data privacy
Privacy is of paramount importance in today's digital era. Ensuring privacy isn't only an ethical responsibility but also crucial for maintaining trust with users and staying compliant with ever-evolving data protection regulations. Dynatrace supports you with data privacy and security tools for RUM and App Function Logs. Find details in the respective section.
Regularly review and update configurations to align with best practices and data protection standards.
Real User Monitoring (RUM)
Gain deep insights into your app users' behaviors with Dynatrace's Real User Monitoring. Quickly identify errors, examine response codes, and dive into user session analysis. All monitoring data is channeled either to a custom-configured environment or to the environment where the Dynatrace app is deployed.
Session Replay is currently not supported for custom apps.
Setting up RUM
To route your Dynatrace app's monitoring data to a target environment, you need to create a RUM application:
- Go to the desired target environment.
- Open the 'Frontend' app and, from the top-right dropdown menu, choose 'Set up agentless monitoring.'
- Provide a descriptive name and click 'Add web application.'
- From the
<script>code section, copy the URL within thesrcattribute (for examplehttps://js-cdn.dynatrace.com/jstag/1234567890a/bf12345678/1234567890abcdef_complete.js).
Use this script in your app configuration file for the selfMonitoringAgent property:
{
  "environmentUrl": "<Your-Environment-URL>",
  "app": {
    "id": "<Your-App-ID>",
    "name": "<Your-App-Name>",
    "version": "0.0.0",
    "description": "<Your-App-Description>",
    "scopes": [],
    "selfMonitoringAgent": "https://js-cdn.dynatrace.com/jstag/1234567890a/bf12345678/1234567890abcdef_complete.js"
  }
}
Save your modifications and redeploy your app. You've now set up RUM monitoring!
Make sure you use RUM JavaScript with a version of >1.271 for the Agentless monitoring setup. To check this (after adding the web application):
- Go to the frontend app and select the newly added web application.
- From the top-right dropdown menu, choose Edit.
- Scroll down and expand the Setup section.
- Select RUM JavaScript updates and check the selected version to be equal/greater than 1.271.
Privacy with RUM
Once RUM is initialized, data is channeled to the pre-defined target environment. Guidance on bolstering security and ensuring data privacy for RUM will lead you through the steps for a secure deployment.
App function logs
Search within logs for errors or specific custom logs related to your app's functions. Logs for Dynatrace app functions are automatically reported in the environment where the app lives. Consider this when deploying your app to a production environment.
Accessing app function logs
No additional configuration is required. Logs are automatically sent to the environment where your Dynatrace app is deployed.
To view them, for instance, launch Notebooks and run the following query:
fetch logs
| filter dt.app.id == "<Your-App-ID>"
Privacy with app function logs
When integrating commands like console.log(data) within your Dynatrace application functions, exercise caution regarding the nature and sensitivity of the data you're recording. Logs, irrespective of their level, are amassed in the environment where the application operates. Our comprehensive guide on log masking provides techniques to circumvent unintended data exposures.
App function traces
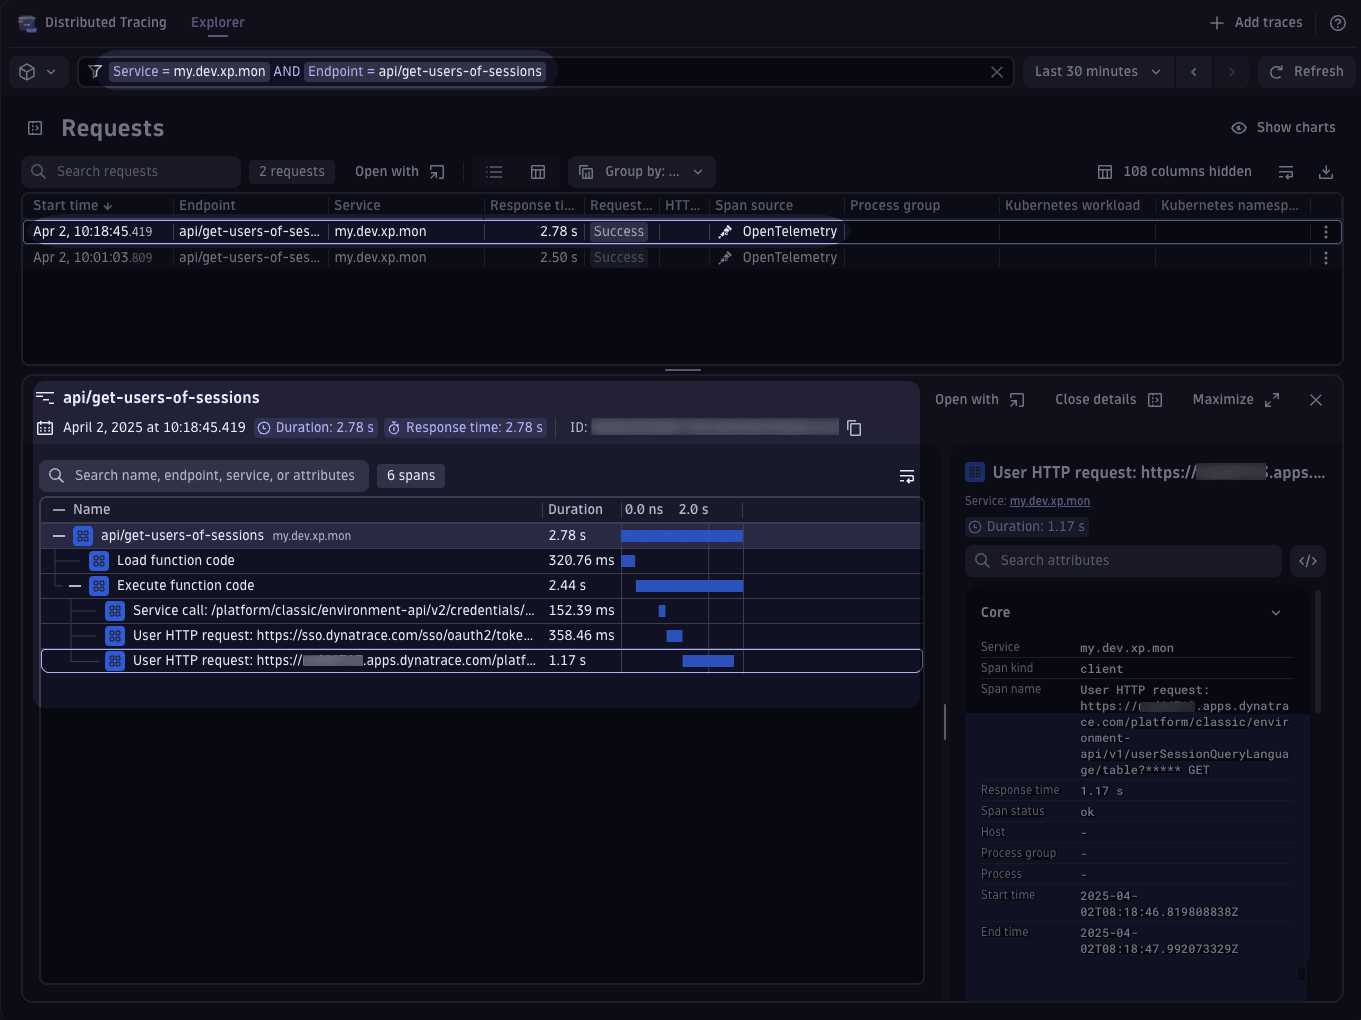
Investigate response times, external request response times, and codes from your app functions. The traces are automatically reported to the environment where the app is executed.
You can easily investigate your app function's traces in the Distributed Tracing app. To find the correct traces, use the AppId with the Service filter tag and the specific app function name with the Endpoint filter tag.

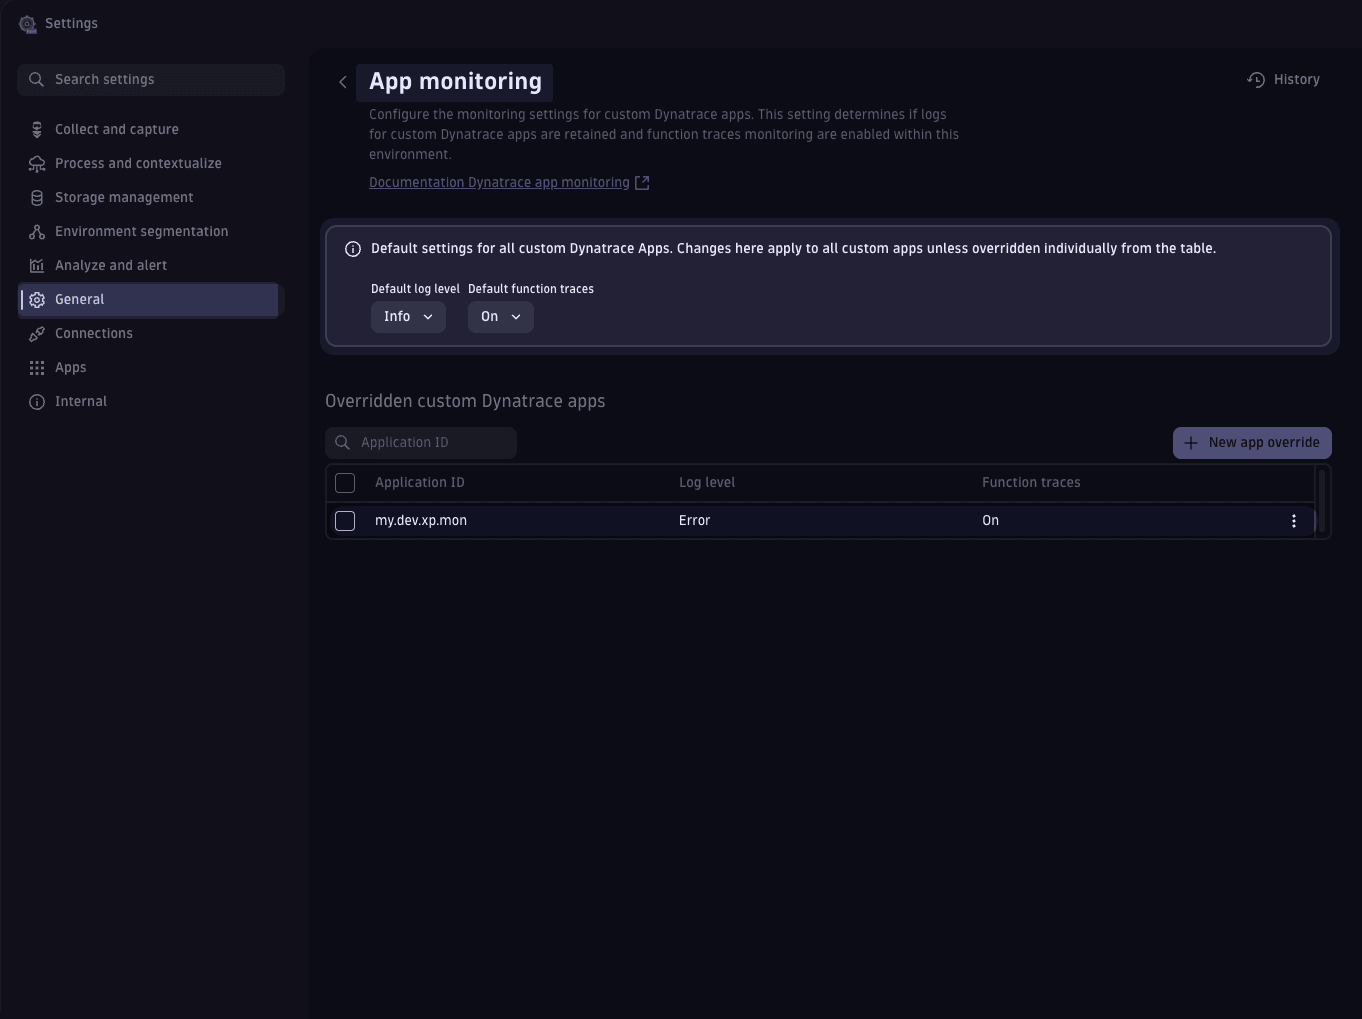
Configure log level and traces reporting
- Go to General
- Expand the App Monitoring Settings panel and:
- Configure the global log level for all Dynatrace function logs.
- Toggle the reporting of traces on and off.
For app-specific configurations, you can define separate settings at the app level.
