Create logs viewer
- How-to guide
- 4-min read
In this guide, you'll learn how to create simple visualizations to gather insights from your log data.
The LogStatusDistribution component
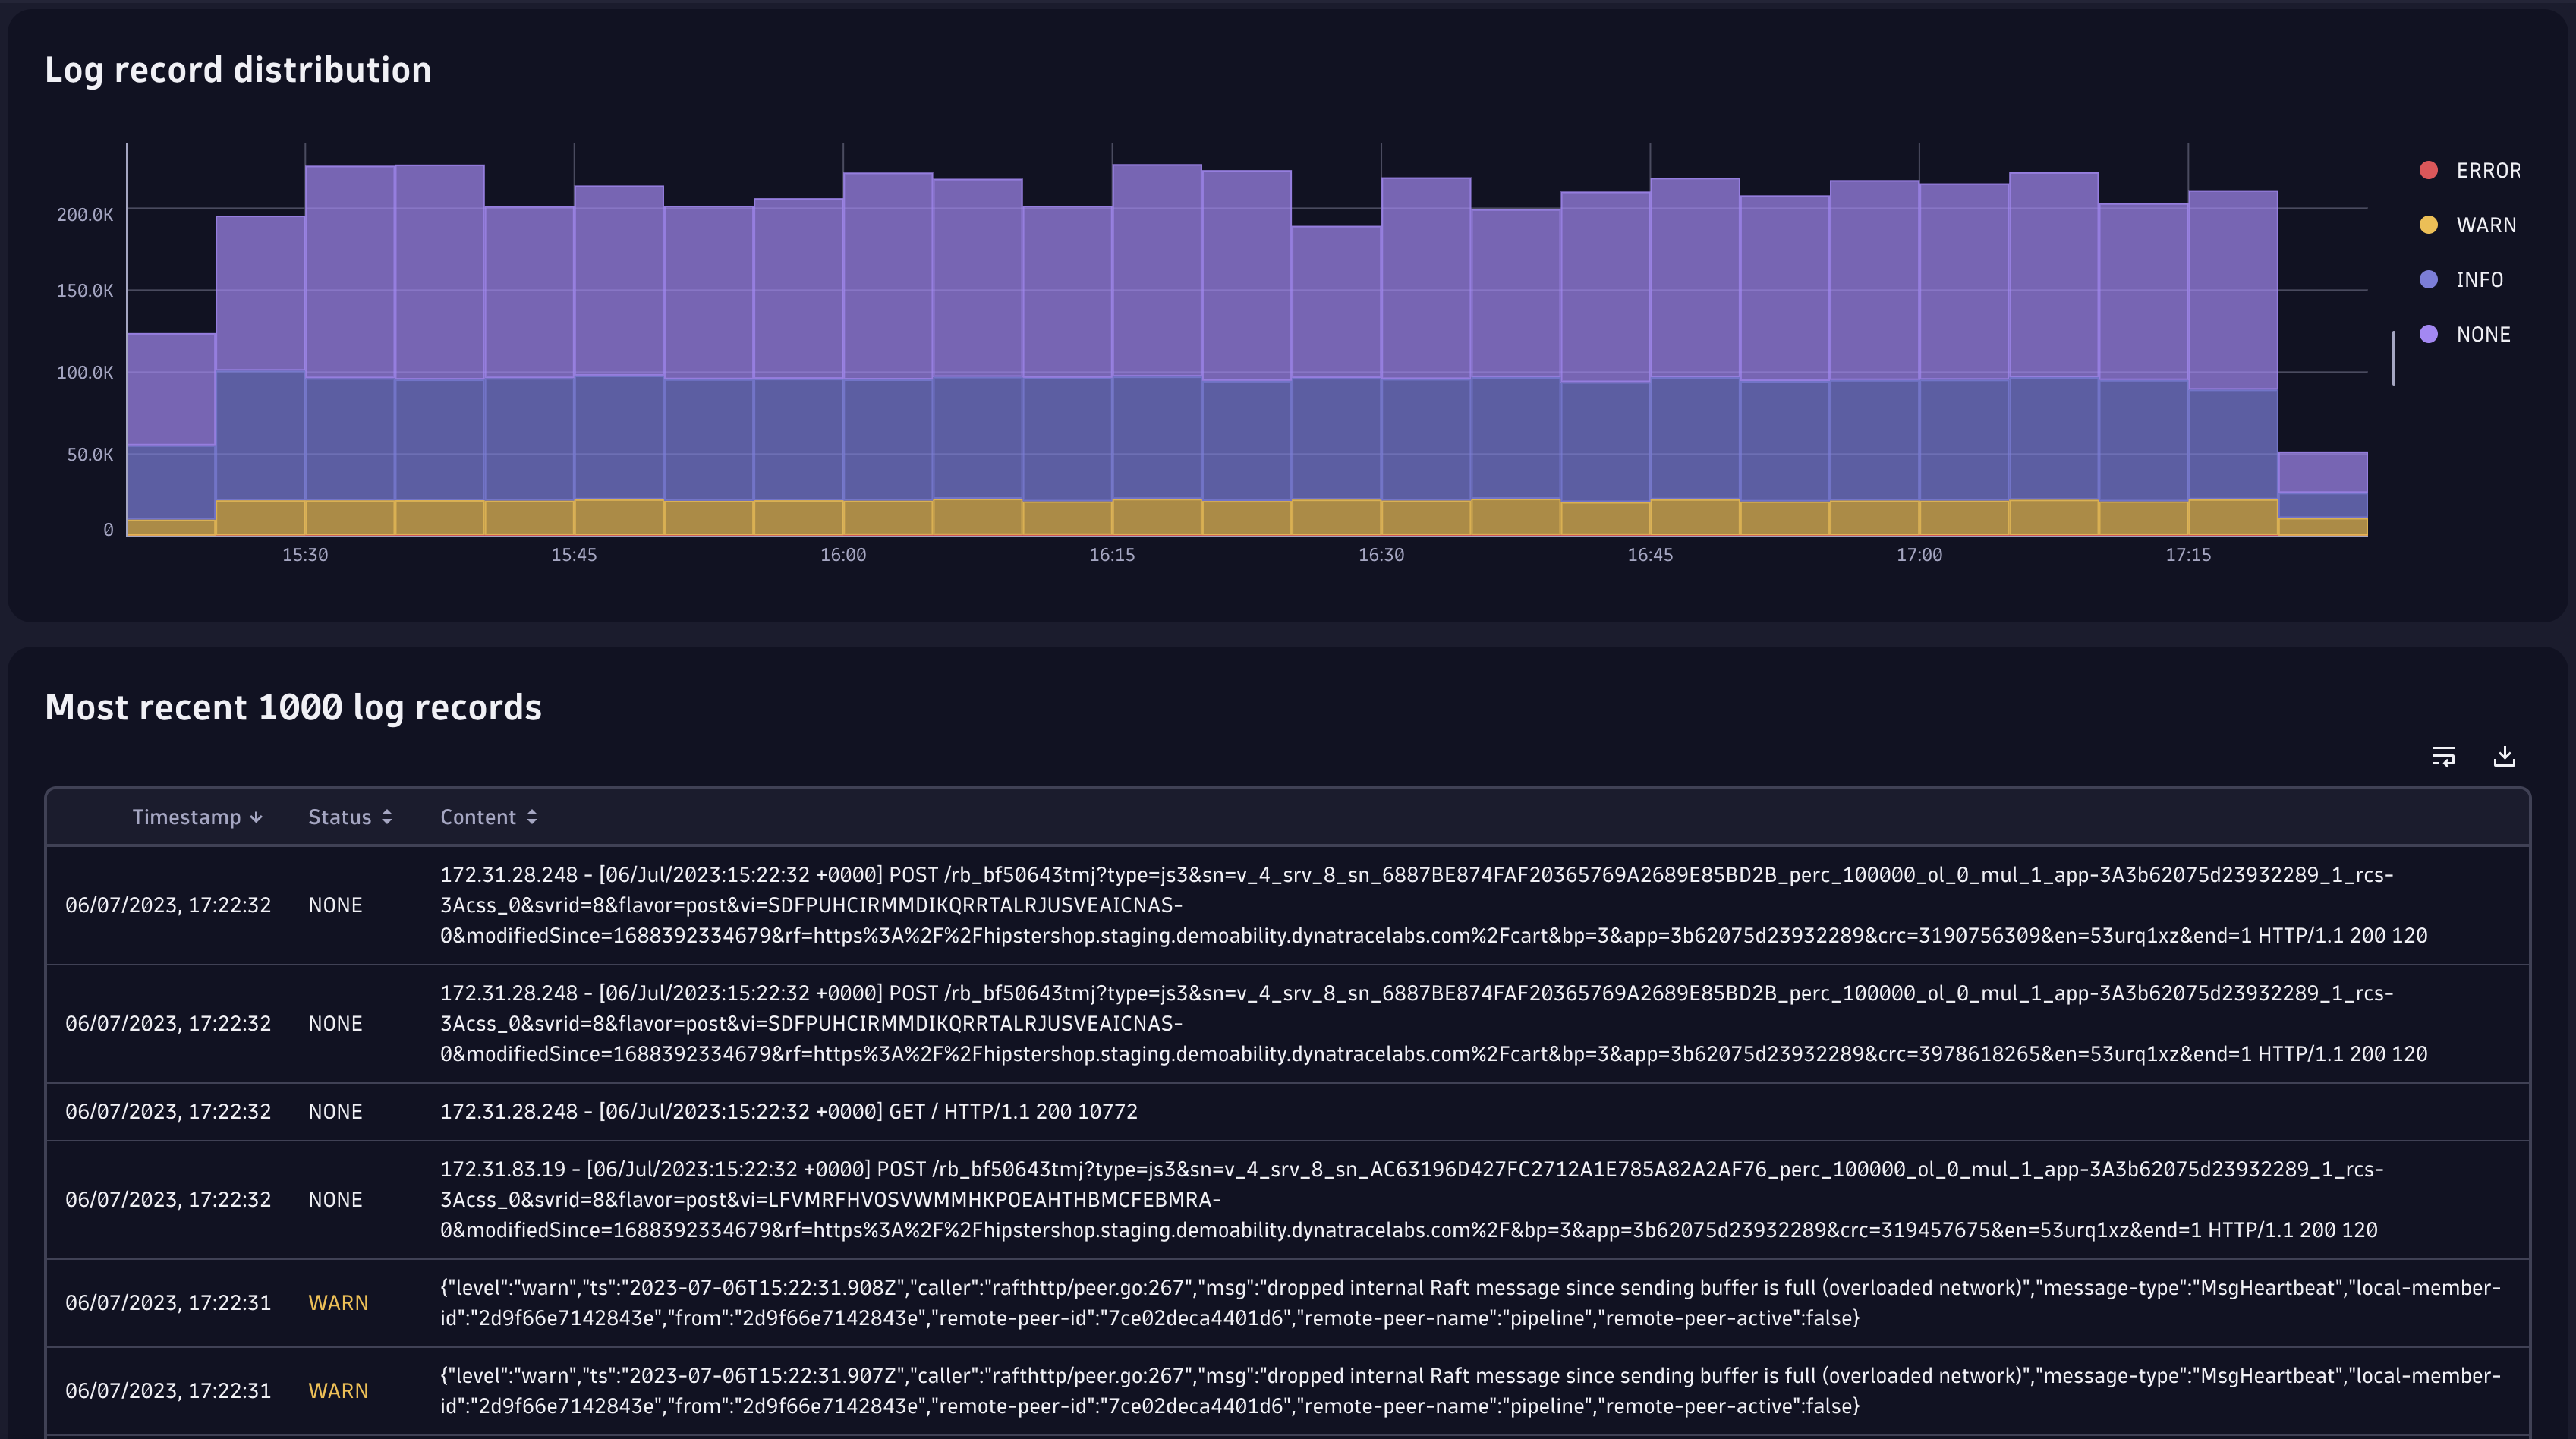
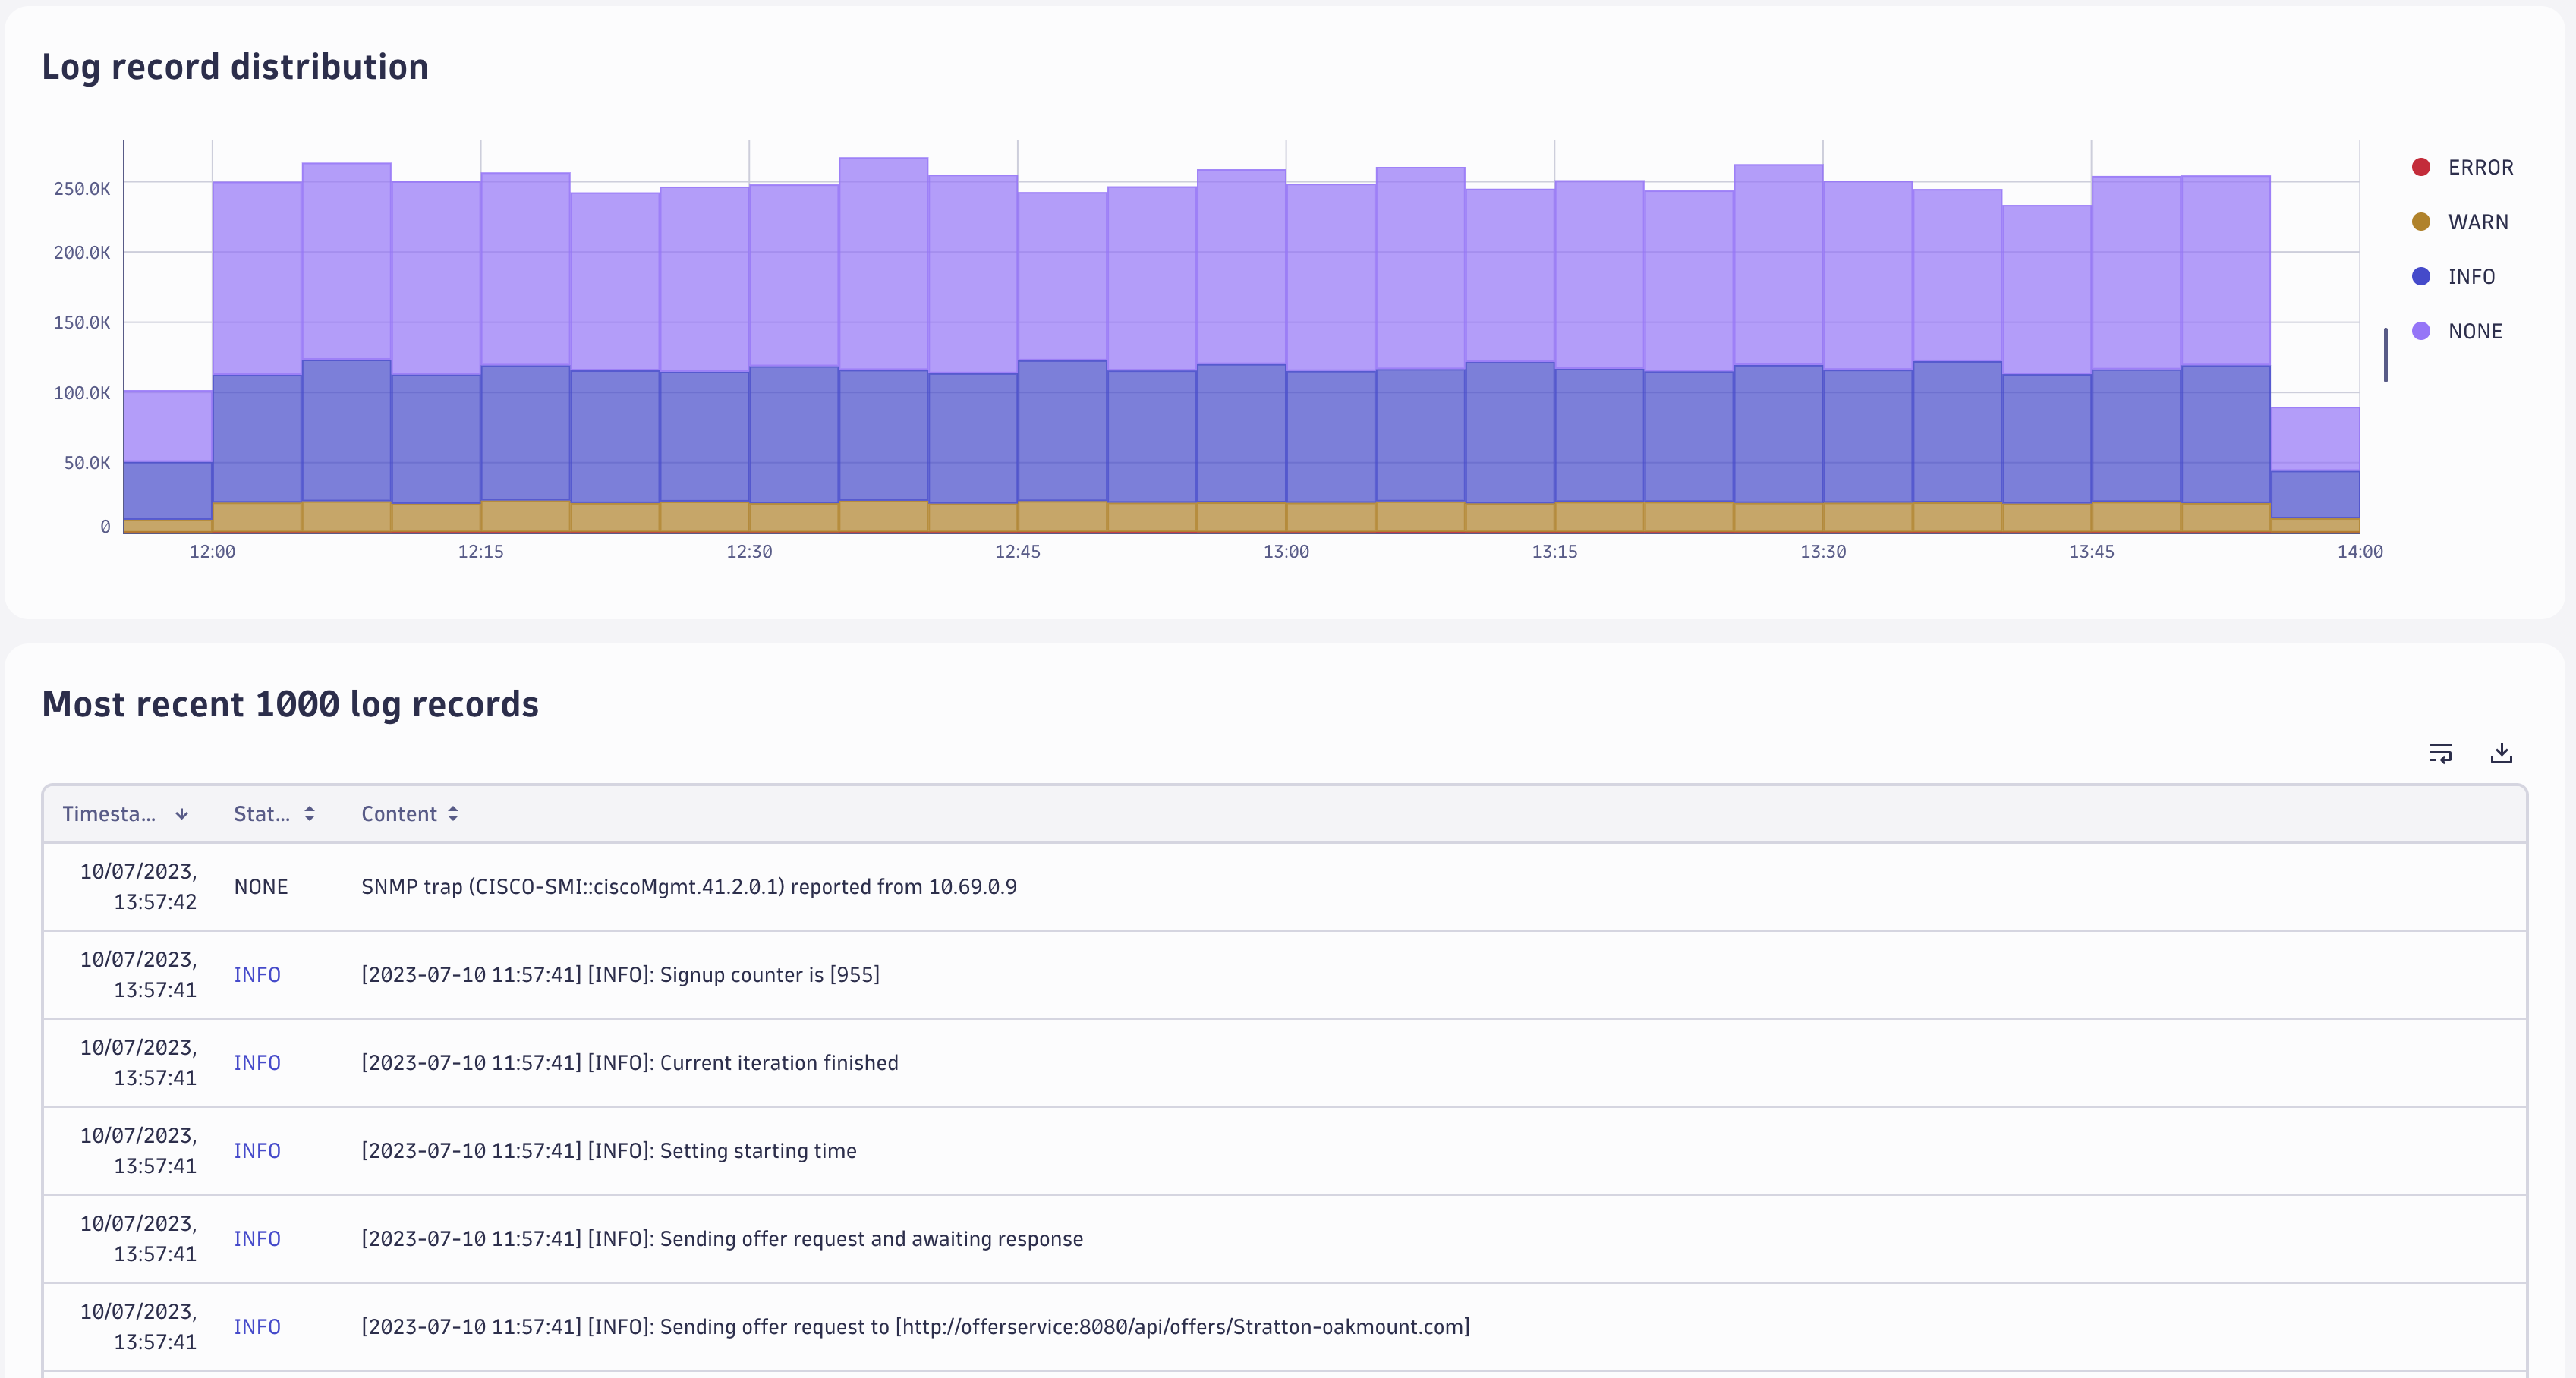
In the LogStatusDistribution component, we'll visualize the log status distribution over time in a bar chart. We'll use DQL to fetch the logs data via the useDql hook and the TimeseriesChart component for the visualization, with a handy predefined log status color palette.
The DQL query is straightforward. Using the makeTimeseries command, we can convert the raw log records to time series. We need to also convert the DQL result to the appropriate type for the TimeseriesChart using the convertToTimeseries function. As we know, DQL doesn't guarantee any specific order in the results, so if we want a consistent and semantically valid visualization, we need to sort the time series data according to the status severity.
import React from 'react';
import { TypedQueryResult, useDql } from '@dynatrace-sdk/react-hooks';
import { Flex } from '@dynatrace/strato-components/layouts';
import { ProgressCircle } from '@dynatrace/strato-components/content';
import { Heading } from '@dynatrace/strato-components/typography';
import {
  convertToTimeseries,
  TimeseriesChart,
  type TimeseriesWithDimensions,
} from '@dynatrace/strato-components/charts';
import { Surface } from '@dynatrace/strato-components/layouts';

const LOG_STATUS_QUERY = `fetch logs
| makeTimeseries count(), by:{status}, interval:5m`;

const getSeriesName = (series: TimeseriesWithDimensions) => {
  return Array.isArray(series.name) ? series.name[0] : series.name;
};

const buildTimeseries = (result: TypedQueryResult) => {
  const timeseries = convertToTimeseries(result.records, result.types, undefined, result.metadata);
  const order = ['ERROR', 'WARN', 'INFO', 'NONE'];
  timeseries.sort((a, b) => order.indexOf(getSeriesName(a)) - order.indexOf(getSeriesName(b)));

  return timeseries;
};

export const LogStatusDistribution = () => {
  const logSeries = useDql({
    query: LOG_STATUS_QUERY,
  });

  return (
    <Surface>
      {logSeries.isLoading && <ProgressCircle />}
      {logSeries.data && (
        <Flex flexDirection="column" gap={24}>
          <Heading level={3}>Log record distribution</Heading>
          <TimeseriesChart colorPalette="log-status" data={buildTimeseries(logSeries.data)} variant="bar" />
        </Flex>
      )}
    </Surface>
  );
};
This operation requires the following scopes:
storage:buckets:readstorage:logs:read
The LogRecords component
The LogRecords component consists of a table with the latest logs generated in our environment. Similar to how we did it in the LogStatusDistribution component, we'll use DQL and the useDql hook, but we'll use the DataTable component for the visualization.
The DQL part is relatively simple. We use the fields command to retrieve only those values that interest us. Then we sort them by timestamp. The DataTable component understands the DQL response format in this case, so no conversion is needed.
The DataTable component is highly customizable. For our use case, we'll configure different colors for the log status using thresholds and color tokens to give instant visual feedback and communicate the severity. We'll also add a toolbar with useful actions, the ability to sort the table, and pagination.
import React from 'react';
import { useDql } from '@dynatrace-sdk/react-hooks';
import { ResultRecord } from '@dynatrace-sdk/client-query';
import { ProgressCircle } from '@dynatrace/strato-components/content';
import { Heading } from '@dynatrace/strato-components/typography';
import { DataTable, DataTableColumnDef } from '@dynatrace/strato-components/tables';
import { Surface } from '@dynatrace/strato-components/layouts';
import Colors from '@dynatrace/strato-design-tokens/colors';

const LOG_RECORDS_QUERY = `fetch logs
| fields timestamp, status, content
| sort timestamp desc`;

const columns: DataTableColumnDef<ResultRecord>[] = [
  {
    header: 'Timestamp',
    id: 'timestamp',
    accessor: 'timestamp',
    width: 'content',
    columnType: 'date',
  },
  {
    header: 'Status',
    id: 'status',
    accessor: 'status',
    width: 'content',

    thresholds: [
      {
        value: 'INFO',
        comparator: 'equal-to',
        color: Colors.Charts.Logstatus.Info.Default,
      },
      {
        value: 'WARN',
        comparator: 'equal-to',
        color: Colors.Charts.Logstatus.Warning.Default,
      },
      {
        value: 'ERROR',
        comparator: 'equal-to',
        color: Colors.Charts.Logstatus.Error.Default,
      },
    ],
  },
  {
    header: 'Content',
    id: 'content',
    accessor: 'content',
  },
];

export const LogRecords = () => {
  const logRecords = useDql({
    query: LOG_RECORDS_QUERY,
  });

  return (
    <Surface>
      {logRecords.isLoading && <ProgressCircle />}
      {logRecords.data && (
        <>
          <Heading level={3}>Most recent {logRecords.data.records.length} log records</Heading>
          <DataTable
            sortable
            defaultSortBy={[{ id: 'timestamp', desc: true }]}
            data={logRecords.data.records}
            columns={columns}
            lineWrap
            fullWidth
          >
            <DataTable.Toolbar>
              <DataTable.DownloadData />
              <DataTable.LineWrap />
            </DataTable.Toolbar>
            <DataTable.Pagination defaultPageSize={20} />
          </DataTable>
        </>
      )}
    </Surface>
  );
};
Putting it together
The last piece of the puzzle is using these components somewhere. We can simply instantiate them in the App component, and we're done.
import React from 'react';
import { Heading } from '@dynatrace/strato-components/typography';
import { Flex } from '@dynatrace/strato-components/layouts';
import { Page } from '@dynatrace/strato-components/layouts';
import { AppHeader } from '@dynatrace/strato-components/layouts';
import { LogStatusDistribution } from './components/LogStatusDistribution';
import { LogRecords } from './components/LogRecords';

export const App = () => {
  return (
    <Page>
      <Page.Header>
        <AppHeader />
      </Page.Header>
      <Page.Main>
        <Flex padding={16} flexDirection="column">
          <Heading level={2}>Logs Viewer</Heading>
          <LogStatusDistribution />
          <LogRecords />
        </Flex>
      </Page.Main>
    </Page>
  );
};
Summary
Just like that, we've created a basic Logs Viewer app in no time. We hope you found this guide helpful and got the inspiration to build more Dynatrace Apps.