Prepare histogram data
- How-to
- 5 minutes
Have you wondered how to prepare data so you can use it in a HistogramChart component? If you're unsure how to query the correct type of data and transform it correctly, this guide will help you.

Get the data
A histogram chart visualizes the distribution in a numerical data set. For this guide, you'll query data from Grail on Discover Dynatrace using useDqlQuery react hook and use business events with credit card data.
You'll use the range function to help structure the query data. The function takes in some numerical data and an interval and returns a start and an end value for each range, as follows:
import React from 'react';
import { useDqlQuery } from '@dynatrace-sdk/react-hooks';

export const HistogramPage = () => {
  const queryResult = useDqlQuery({
    body: {
      query: `fetch bizevents
      | filter isNotNull(amount) and isNotNull(cardType)
      | summarize count = count(), by:{cardType, range = range(amount, 100)}`,
    },
  });
};
This operation requires the scope storage:bizevents:read. Read more about scopes in this guide.
Now that you've got the data, the next step is to convert the data to pass it to the component.
Convert the queried data
The HistogramChart component expects HistogramSeries[] as data prop. A HistogramSeries object contains HistogramBin[] and name property. The HistogramBin object consists of value, start, and end. The start and end properties correspond with the start and end values from the query result. In the code below, you extract these values from the query result and construct a HistogramSeries[] that you can pass to the component, as follows:
import React from 'react';
import { useDqlQuery } from '@dynatrace-sdk/react-hooks';
import { QueryResult } from '@dynatrace-sdk/client-query';
import { HistogramSeries } from '@dynatrace/strato-components-preview/charts';

const convertQueryResult = (data: QueryResult): HistogramSeries[] => {
  const result = new Map<string, HistogramSeries>();

  for (const record of data.records) {
    if (!record) continue;
    const creditCard = record['cardType'] as string;
    const amount = Number(record['count']);

    const range = record['range'];
    if (!range) continue;
    const start = Number(range['start']);
    const end = Number(range['end']);

    let series = result.get(creditCard);
    if (!series) {
      series = { name: creditCard, bins: [] };
      result.set(creditCard, series);
    }
    series.bins.push({ from: start, to: end, value: amount });
  }
  return Array.from(result.values());
};

export const HistogramPage = () => {
  const queryResult = useDqlQuery({
    body: {
      query: `fetch bizevents
      | filter isNotNull(amount) and isNotNull(cardType)
      | summarize count = count(), by:{cardType, range = range(amount, 100)}`,
    },
  });
};
Display the data in the component
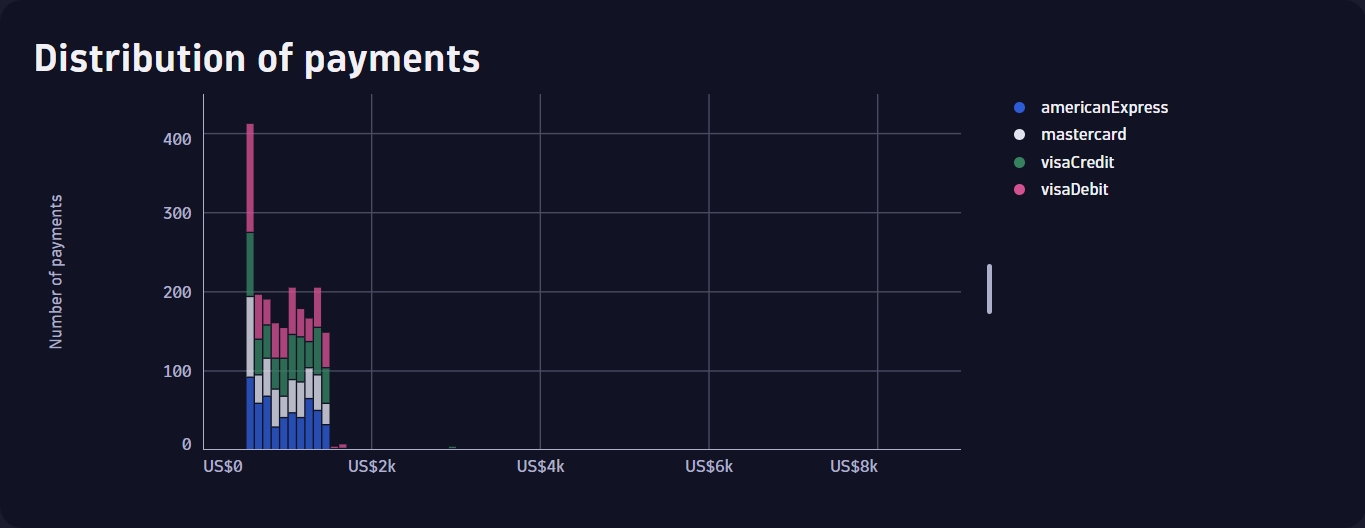
Now that you've queried and converted the data, the next step is to make it visible in the UI. As shown in the code below, you create a new component for our chart and import the necessary components. Then, you pass the function with the data as its argument to the HistogramChart component, as follows:
import React from 'react';
import { useDqlQuery } from '@dynatrace-sdk/react-hooks';
import { QueryResult } from '@dynatrace-sdk/client-query';
import { Heading } from '@dynatrace/strato-components/typography';
import { ProgressCircle } from '@dynatrace/strato-components/content';
import { HistogramChart, HistogramSeries } from '@dynatrace/strato-components-preview/charts';
import { Surface } from '@dynatrace/strato-components-preview/layouts-core';
import { units } from '@dynatrace-sdk/units';

const convertQueryResult = (data: QueryResult): HistogramSeries[] => {
  const result = new Map<string, HistogramSeries>();

  for (const record of data.records) {
    if (!record) continue;
    const creditCard = record['cardType'] as string;
    const amount = Number(record['count']);

    const range = record['range'];
    if (!range) continue;
    const start = Number(range['start']);
    const end = Number(range['end']);

    let series = result.get(creditCard);
    if (!series) {
      series = { name: creditCard, bins: [] };
      result.set(creditCard, series);
    }
    series.bins.push({ from: start, to: end, value: amount });
  }
  return Array.from(result.values());
};

export const HistogramPage = () => {
  const queryResult = useDqlQuery({
    body: {
      query: `fetch bizevents
      | filter isNotNull(amount) and isNotNull(cardType)
      | summarize count = count(), by:{cardType, range = range(amount, 100)}`,
    },
  });

  return (
    <Surface>
      <Heading level={2}>Distribution of payments</Heading>
      {queryResult.isLoading && <ProgressCircle />}
      {queryResult.data && (
        <HistogramChart data={convertQueryResult(queryResult.data)}>
          <HistogramChart.XAxis formatter={{ input: units.currency.usd }} />
          <HistogramChart.YAxis label="Number of payments" />
        </HistogramChart>
      )}
    </Surface>
  );
};
Summary
In this guide, you queried numerical data from Grail and then transformed it into a form that the HistogramChart component accepts. Finally, you displayed the data in a histogram chart.
Here's the complete code with all the pieces put together:
Full code example
import React from 'react';
import { QueryResult } from '@dynatrace-sdk/client-query';
import { useDqlQuery } from '@dynatrace-sdk/react-hooks';
import { Heading } from '@dynatrace/strato-components/typography';
import { ProgressCircle } from '@dynatrace/strato-components/content';
import { HistogramChart, HistogramSeries } from '@dynatrace/strato-components-preview/charts';
import { Surface } from '@dynatrace/strato-components-preview/layouts-core';
import { units } from '@dynatrace-sdk/units';

const convertQueryResult = (data: QueryResult): HistogramSeries[] => {
  const result = new Map<string, HistogramSeries>();

  for (const record of data.records) {
    if (!record) continue;
    const creditCard = record['cardType'] as string;
    const amount = Number(record['count']);

    const range = record['range'];
    if (!range) continue;
    const start = Number(range['start']);
    const end = Number(range['end']);

    let series = result.get(creditCard);
    if (!series) {
      series = { name: creditCard, bins: [] };
      result.set(creditCard, series);
    }
    series.bins.push({ from: start, to: end, value: amount });
  }
  return Array.from(result.values());
};

export const HistogramPage = () => {
  const queryResult = useDqlQuery({
    body: {
      query: `fetch bizevents
      | filter isNotNull(amount) and isNotNull(cardType)
      | summarize count = count(), by:{cardType, range = range(amount, 100)}`,
    },
  });

  return (
    <Surface>
      <Heading level={2}>Distribution of payments</Heading>
      {queryResult.isLoading && <ProgressCircle />}
      {queryResult.data && (
        <HistogramChart data={convertQueryResult(queryResult.data)}>
          <HistogramChart.XAxis formatter={{ input: units.currency.usd }} />
          <HistogramChart.YAxis label="Number of payments" />
        </HistogramChart>
      )}
    </Surface>
  );
};
Further info
The Strato design system provides some conversions. You can find them in the Strato design system reference under Components preview > Conversion-utils. Ensure your use case isn't covered before writing your conversion.