Improve visualizations
- Tutorial
- 7 minutes
The Strato design system offers various options to improve our app's visualization and user experience. In this section, we'll do the following:
- Add a loading indicator
- Add the pagination to our table
- Improve the table visualizations
1. Add a loading indicator and pagination
To improve our app's user experience, let's add a loading indicator and pagination to the table as follows:
import React from 'react';
import { Flex } from '@dynatrace/strato-components/layouts';
import { TitleBar } from '@dynatrace/strato-components-preview/layouts';
import {
  ProgressCircle
} from '@dynatrace/strato-components/content';
import { convertToColumnsV2 } from '@dynatrace/strato-components-preview/conversion-utilities';
import { DataTableV2 } from '@dynatrace/strato-components-preview/tables';
import { useDql } from '@dynatrace-sdk/react-hooks';
import { CPU_USAGE_QUERY } from '../queries';

export const HostList = () => {
  const result = useDql({
    query: CPU_USAGE_QUERY,
  });

  return (
    <Flex width="100%" flexDirection="column" justifyContent="center" gap={16}>
      <TitleBar>
        <TitleBar.Title>Hosts Insights</TitleBar.Title>
      </TitleBar>
      {result.isLoading && <ProgressCircle />}
      {result.data && (
        <DataTableV2 data={result.data.records} columns={convertToColumnsV2(result.data.types)} fullWidth>
          <DataTableV2.Pagination />
        </DataTableV2>
      )}
    </Flex>
  );
};
Learn more about ProgressCircle.
After the changes, the app should look like the following:

2. Custom column definition
The DataTableV2 component is very customizable. One of the most important customizations is that of the columns. In this part, we'll customize the table columns using different column types.
1. Host ID and name
First, we'll show only two columns in the table, Host ID and Host name.
To start, import the DataTableV2ColumnDef. Then, create a new columns variable and memoize it using useMemo. Next, add the host ID and name column definitions, and replace the convertToColumnsV2 call in the template with the newly created columns. Since you're not using convertToColumnsV2 any longer, you can remove its import as well, as shown below:
import React, { useMemo } from 'react';
import { ResultRecord } from '@dynatrace-sdk/client-query';
import { Flex } from '@dynatrace/strato-components/layouts';
import { TitleBar } from '@dynatrace/strato-components-preview/layouts';
import { ProgressCircle } from '@dynatrace/strato-components/content';
import {
  DataTableV2,
  DataTableV2ColumnDef,
} from '@dynatrace/strato-components-preview/tables';
import { useDql } from '@dynatrace-sdk/react-hooks';
import { CPU_USAGE_QUERY } from '../queries';

export const HostList = () => {
  const result = useDql({
    query: CPU_USAGE_QUERY,
  });

  const columns = useMemo<DataTableV2ColumnDef<ResultRecord | null>[]>(
    () => [
      {
        id: 'hostId',
        header: 'Host ID',
        accessor: 'hostId',
        width: 'content',
      },
      {
        id: 'hostName',
        header: 'Host name',
        accessor: 'hostName',
        width: 'content',
      },
    ],
    [result],
  );

  return (
    <Flex width="100%" flexDirection="column" justifyContent="center" gap={16}>
      <TitleBar>
        <TitleBar.Title>Hosts Insights</TitleBar.Title>
      </TitleBar>
      {result.isLoading && <ProgressCircle />}
      {result.data && (
        <DataTableV2 data={result.data.records} columns={columns} fullWidth>
          <DataTableV2.Pagination />
        </DataTableV2>
      )}
    </Flex>
  );
};
The table now looks like this:
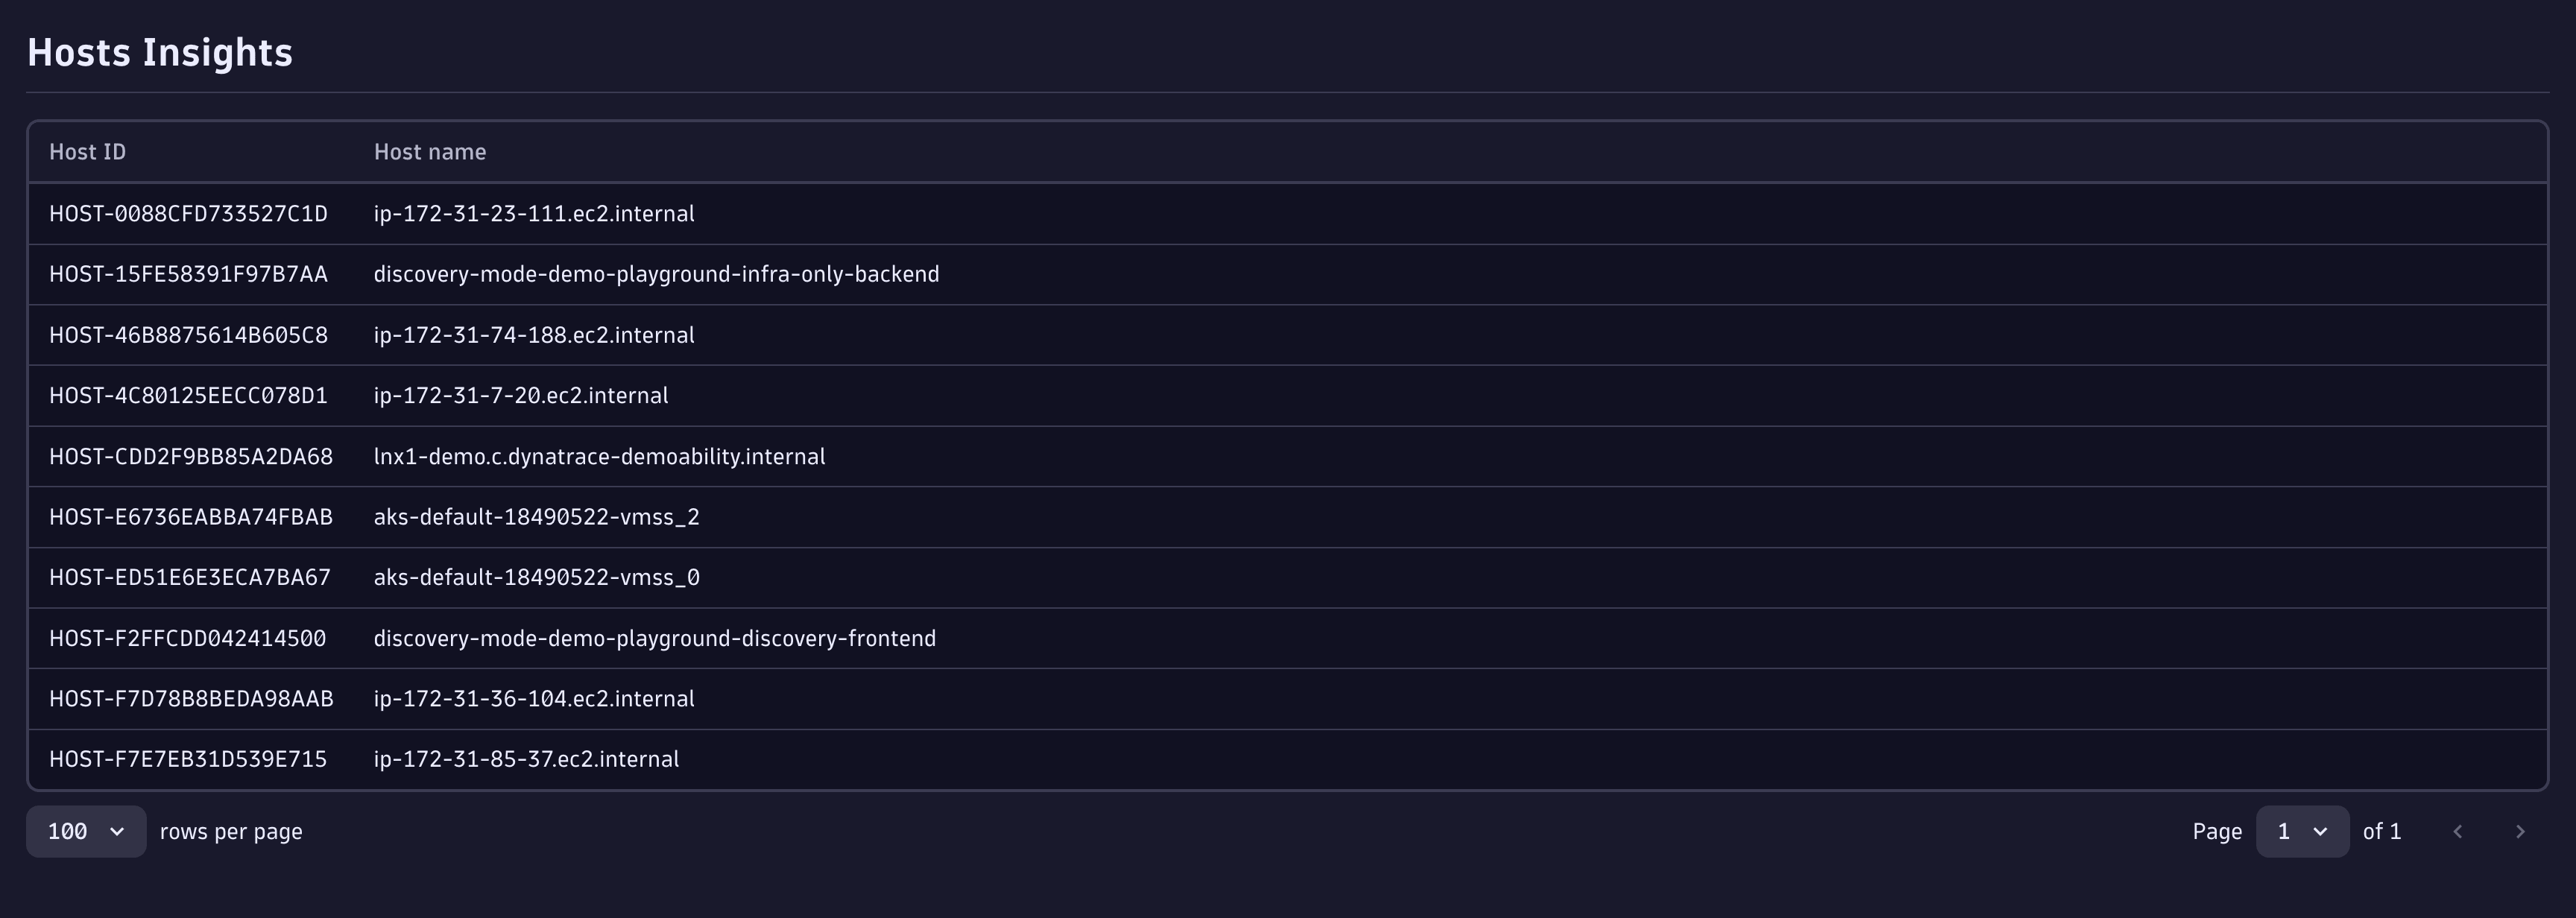
You might have already noticed that the header is the text that appears as the column header in the table. Also, the width: 'content' ensures the columns take up as much space as the content.
The accessor property configures how the DataTableV2 gets that column's data. In this case, it gets the data from the Dynatrace Query Language (DQL) result using the hostId and hostName fields.
2. CPU usage
Before we removed it in the previous step, the CPU usage section looked like the following:
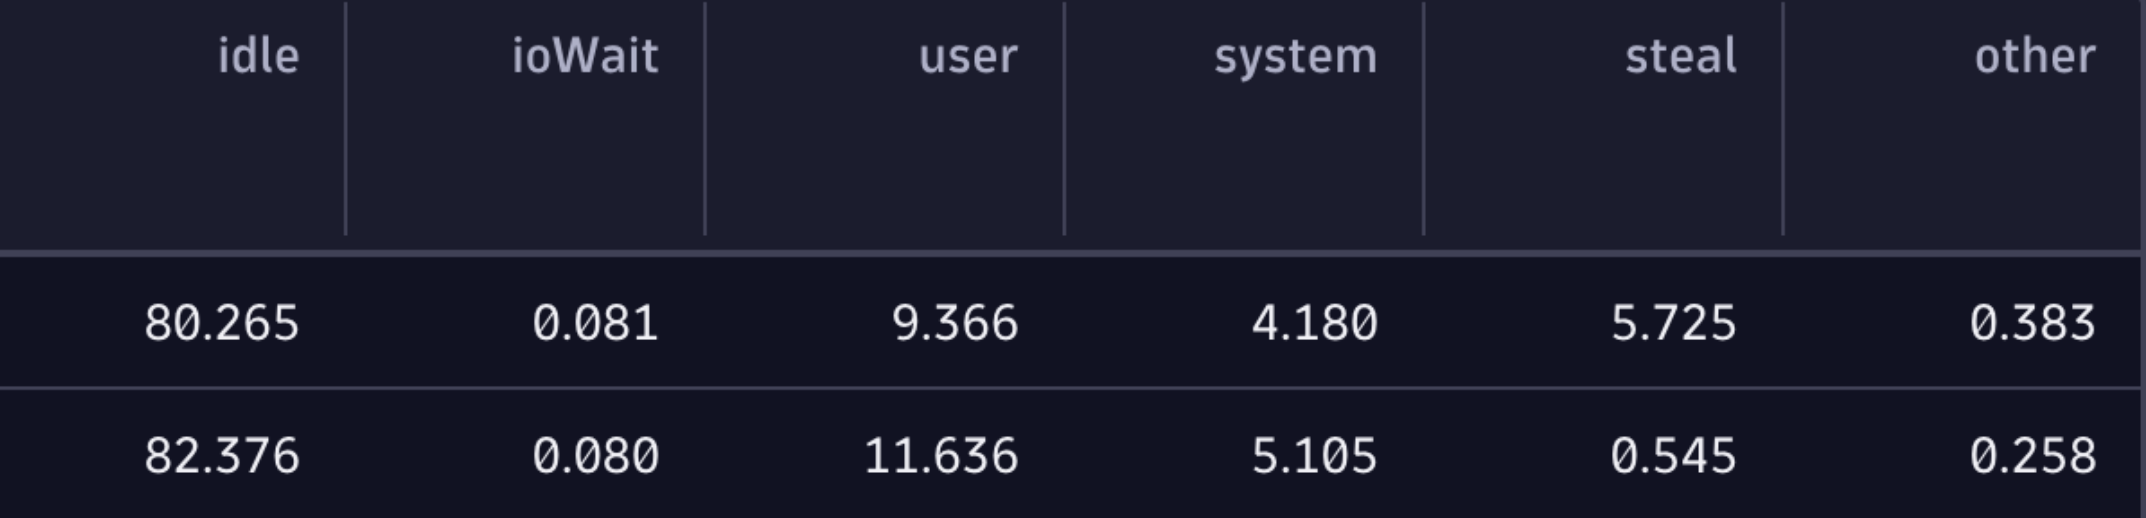
However, we can visualize this information more meaningfully using the meter bar chart.
Start by adding a HostData type with relevant properties as shown.
To add such a chart to the table, we need to create a new custom column of type meterbar. The accessor property needs to be a function that returns the data we want to represent in the given column. In this case, we also need to specify the id property.
The accessor has access to all the row values from the DQL result. Therefore, we can use idle, user, and the other DQL columns for the meterbar. In this case, the accessor function returns an array of objects containing CPU metrics like CPU idle, CPU user, and others. We'll also set showTooltip to true in the config object and set width to 1fr as follows:
import React, { useMemo } from 'react';
import { ResultRecord } from '@dynatrace-sdk/client-query';
import { Flex } from '@dynatrace/strato-components/layouts';
import { TitleBar } from '@dynatrace/strato-components-preview/layouts';
import { ProgressCircle } from '@dynatrace/strato-components/content';
import { DataTableV2, DataTableV2ColumnDef } from '@dynatrace/strato-components-preview/tables';
import { useDql } from '@dynatrace-sdk/react-hooks';
import { CPU_USAGE_QUERY } from '../queries';

type HostData = {
  idle: number;
  ioWait: number;
  other: number;
  steal: number;
  system: number;
  user: number;
};

export const HostList = () => {
  const result = useDql({
    query: CPU_USAGE_QUERY,
  });

  const columns = useMemo<DataTableV2ColumnDef<ResultRecord | null>[]>(
    () => [
      {
        id: 'hostId',
        header: 'Host ID',
        accessor: 'hostId',
        width: 'content',
      },
      {
        id: 'hostName',
        header: 'HostName',
        accessor: 'hostName',
        width: 'content',
      },
      {
        id: 'cpuUsage',
        header: 'CPU Usage',
        columnType: 'meterbar',
        accessor: ({ idle, ioWait, user, system, steal, other }: HostData) => [
          { name: 'CPU idle', value: idle },
          { name: 'I/O wait', value: ioWait },
          { name: 'CPU user', value: user },
          { name: 'CPU system', value: system },
          { name: 'CPU steal', value: steal },
          { name: 'CPU other', value: other },
        ],
        config: {
          showTooltip: true,
        },
        width: '1fr',
      },
    ],
    [result],
  );

  return (
    <Flex width="100%" flexDirection="column" justifyContent="center" gap={16}>
      <TitleBar>
        <TitleBar.Title>Hosts Insights</TitleBar.Title>
      </TitleBar>
      {result.isLoading && <ProgressCircle />}
      {result.data && (
        <DataTableV2 data={result.data.records as HostData[]} columns={columns} fullWidth>
          <DataTableV2.Pagination />
        </DataTableV2>
      )}
    </Flex>
  );
};
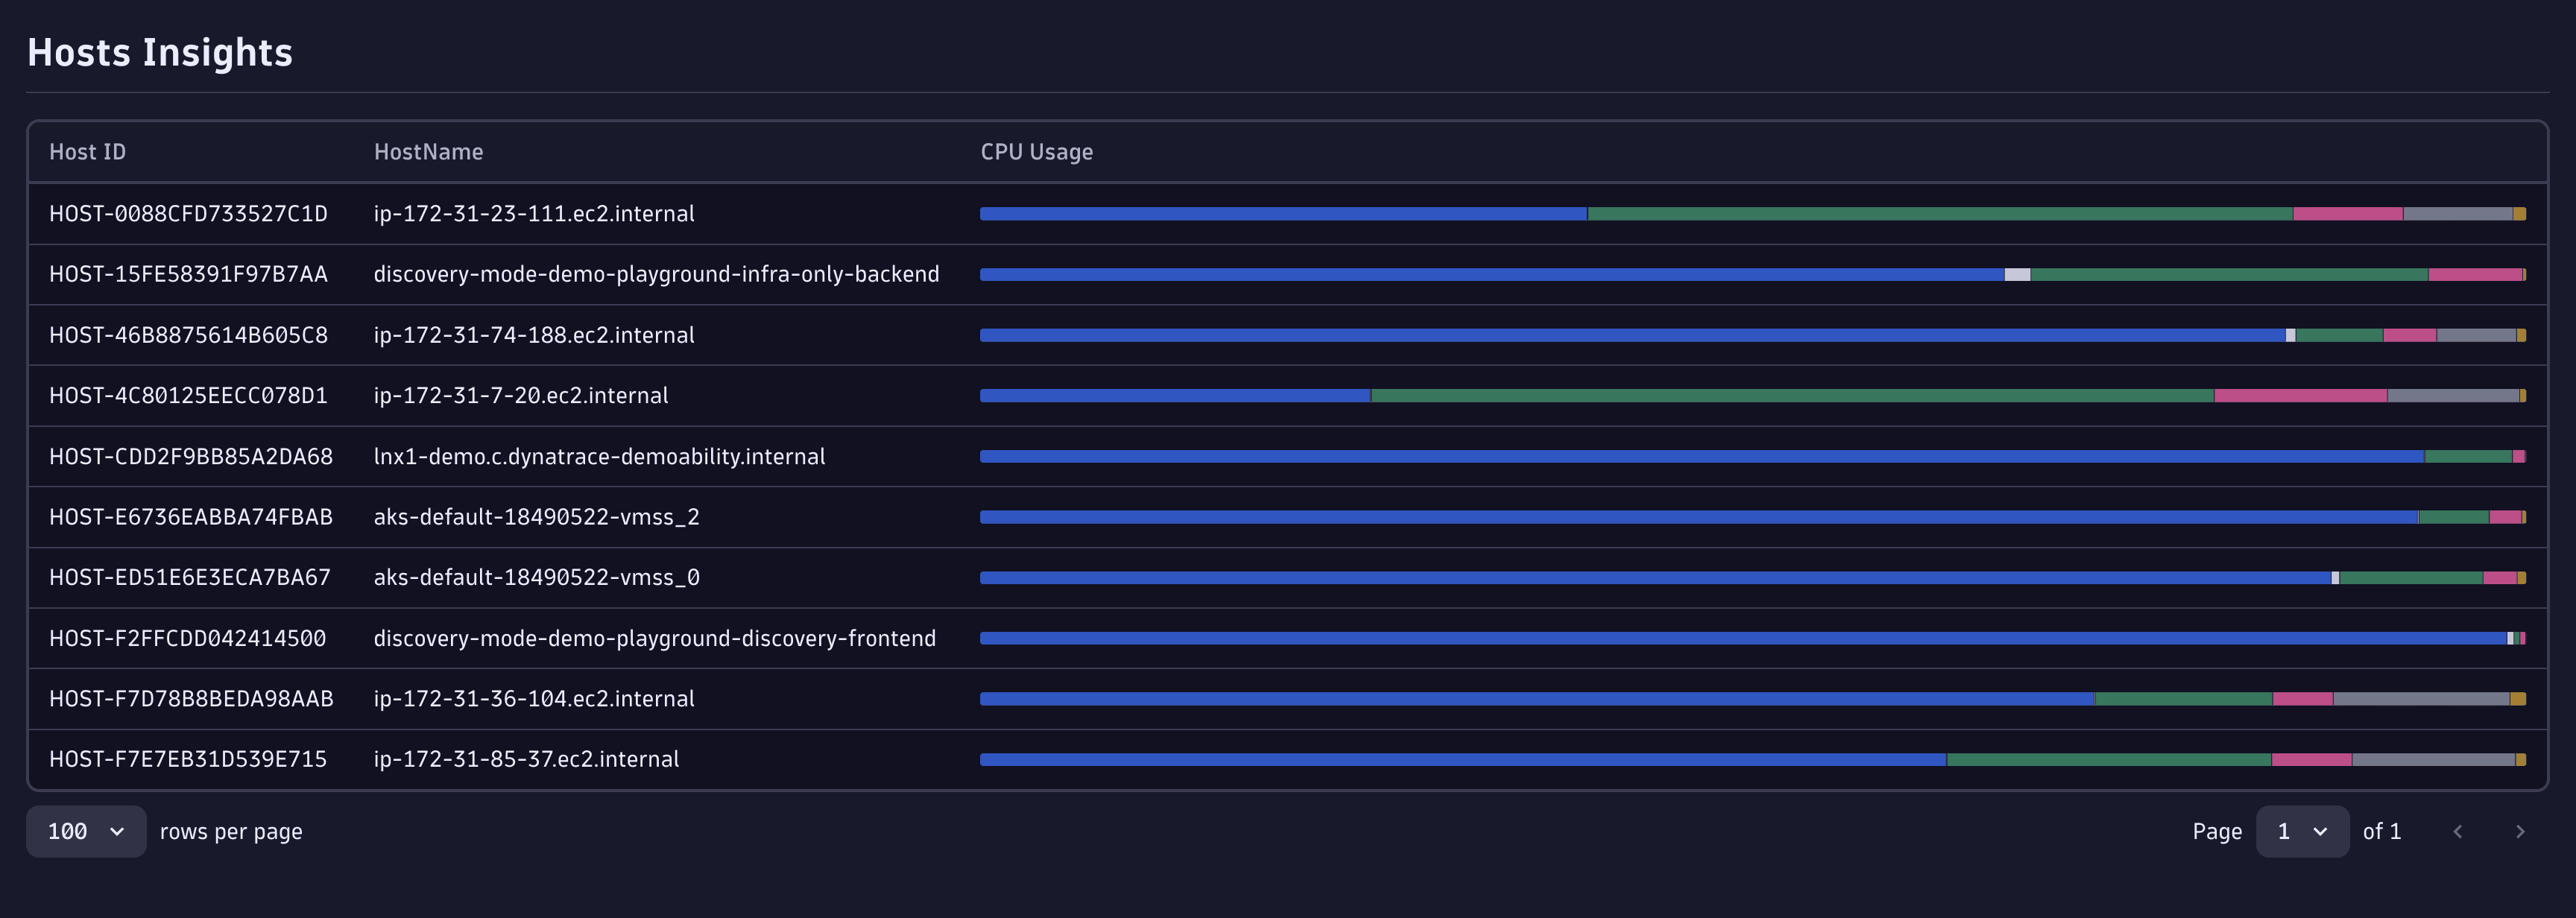
Learn more about the meterbar column type.
Now, the table looks like this:
3. Average CPU
Another essential information we can add to our table is average CPU data. To do that, we'll use the sparkline visualization.
Start by creating a new column of type sparkline in our column array. This column type needs time series data. Therefore, we'll need to use the convertToTimeseries function in the accessor function.
The convertToTimeseries function takes two parameters. The first is the array of data; in our case, it's the row data in an array, and the second is the type definition of the data returned in the DQL result.
Finally, add a width of 1fr and change the color of the sparkline by using Strato design tokens.
Learn more about Strato Design Tokens.
After the changes, the complete code is as follows:
import React, { useMemo } from 'react';
import { ResultRecord } from '@dynatrace-sdk/client-query';
import { Flex } from '@dynatrace/strato-components/layouts';
import { TitleBar } from '@dynatrace/strato-components-preview/layouts';
import { ProgressCircle } from '@dynatrace/strato-components/content';
import { convertToTimeseries } from '@dynatrace/strato-components-preview/conversion-utilities';
import { DataTableV2, DataTableV2ColumnDef } from '@dynatrace/strato-components-preview/tables';
import { useDql } from '@dynatrace-sdk/react-hooks';
import { CPU_USAGE_QUERY } from '../queries';
import Colors from '@dynatrace/strato-design-tokens/colors';

type HostData = {
  hostId: string;
  hostName: string;
  idle: number;
  ioWait: number;
  other: number;
  steal: number;
  system: number;
  user: number;
};

export const HostList = () => {
  const result = useDql({
    query: CPU_USAGE_QUERY,
  });

  const columns = useMemo<DataTableV2ColumnDef<ResultRecord | null>[]>(
    () => [
      {
        id: 'hostId',
        header: 'Host ID',
        accessor: 'hostId',
        width: 'content',
      },
      {
        id: 'hostName',
        header: 'HostName',
        accessor: 'hostName',
        width: 'content',
      },
      {
        id: 'cpuUsage',
        header: 'CPU Usage',
        columnType: 'meterbar',
        accessor: ({ idle, ioWait, user, system, steal, other }: HostData) => [
          { name: 'CPU idle', value: idle },
          { name: 'I/O wait', value: ioWait },
          { name: 'CPU user', value: user },
          { name: 'CPU system', value: system },
          { name: 'CPU steal', value: steal },
          { name: 'CPU other', value: other },
        ],
        config: {
          showTooltip: true,
        },
        width: '1fr',
      },
      {
        id: 'cpuAvg',
        header: 'Average CPU %',
        columnType: 'sparkline',
        accessor: (row) => (result.data ? convertToTimeseries([row], result.data.types) : []),
        config: {
          color: Colors.Charts.Rainbow.Magenta.Default,
        },
        width: '1fr',
      },
    ],
    [result],
  );

  return (
    <Flex width="100%" flexDirection="column" justifyContent="center" gap={16}>
      <TitleBar>
        <TitleBar.Title>Hosts Insights</TitleBar.Title>
      </TitleBar>
      {result.isLoading && <ProgressCircle />}
      {result.data && (
        <DataTableV2 data={result.data.records} columns={columns} fullWidth>
          <DataTableV2.Pagination />
        </DataTableV2>
      )}
    </Flex>
  );
};
Learn more about the sparkline column type.
At this point, our app should look like the following:
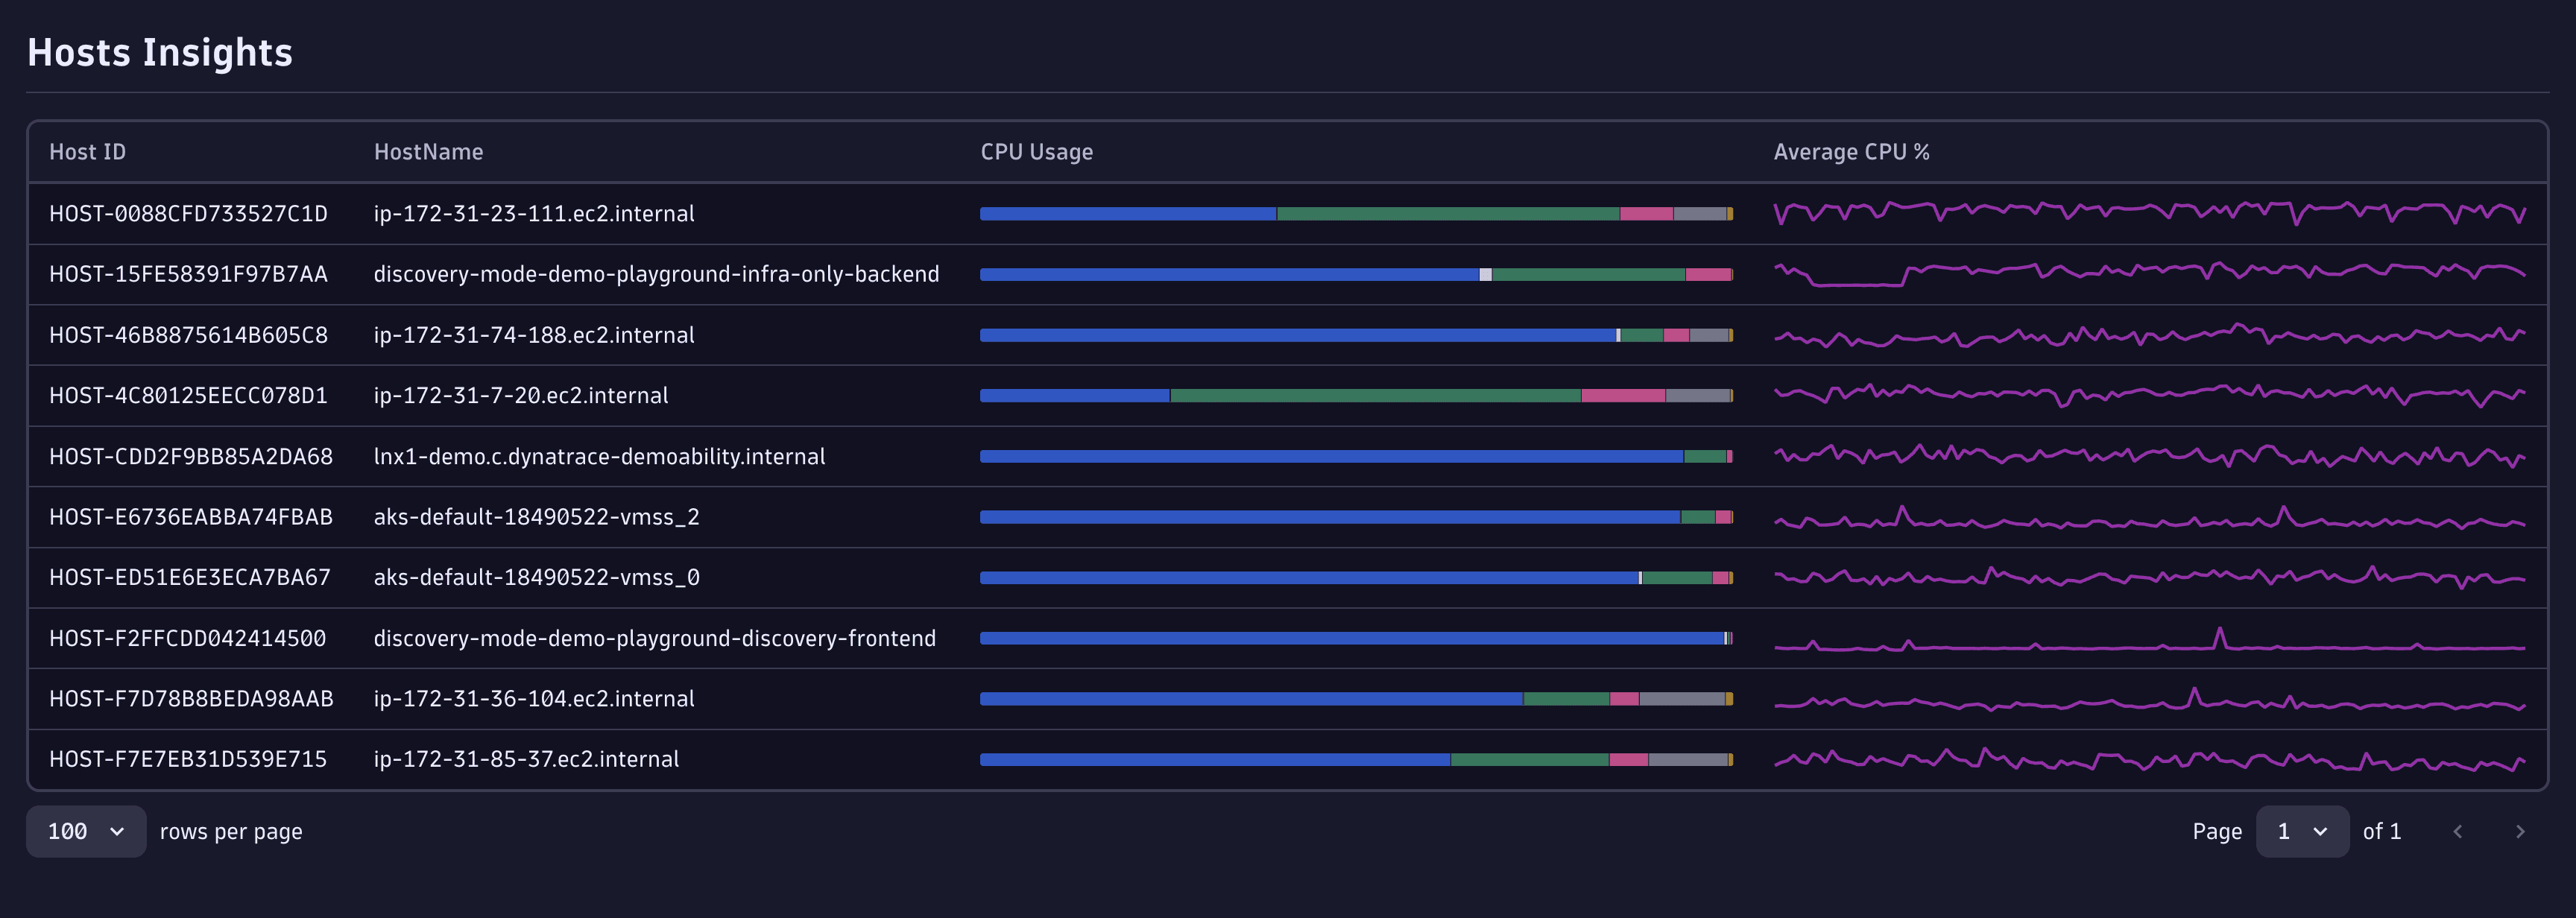
You've successfully improved the user experience and data visualization in our app. In the next section, we'll extend our app's functionality by sharing data between apps.