Development assistance
Dynatrace Extensions leverages the full power of your VS Code editor to help you create better extensions faster.
Read on to learn how to make the most out of these features.
Feature overview
| Feature type | Description |
|---|---|
| Code completions | Suggestions for auto-completing words or fields of the manifest |
| Code actions | Commands generating or editing the content of your extension's manifest |
| Code lens | Additional commands to interact with extension data |
| Fast development mode | A workflow focused on speed of delivery |
| Diagnostics | Additional diagnostics beyond simple schema validation |
Code completions
Code completions or suggestions happen at key points within the extension manifest. Either automatically or on-demand (using Ctrl + Space), these offer known values that can be inserted at the location of your cursor.
Implemented triggers
| Keyword trigger | Effects |
|---|---|
On fromType: or toType: inside topology.relationships list items | Browse built-in and custom entity types |
On sourceAttribute: inside mappingRules list items of topology relationships | Browse entity attributes (entity needs to be present in the fromType attribute) |
On destinationAttribute: inside mappingRules list items of topology relationships | Browse entity attributes (entity needs to be present in toType attribute) |
On entityType: and entityTypes: | Browse relevant entity types |
On key: (of attributes inside screen properties) | Attributes are suggested from topology and built-in values |
On entitySelectorTemplate: | Use Ctrl + Space to trigger completions as you build your selector or choose one of the pre-built selectors (from relationships seen in your manifest) |
On iconPattern: (within topology rules) or icon: (within staticContent header) | Browse available Barista icon codes |
On key: (of cards in screens, either in layout or individual lists) | Browse keys of cards defined but not yet utilized |
On value:, for metrics and dimensions of a Prometheus extension | Browse metrics and dimensions scraped using the Prometheus code lens |
On description: (in the metrics section of the manifest) | For those metrics that have been scraped using the Prometheus code lens, add the description from the scraped data |
Code actions
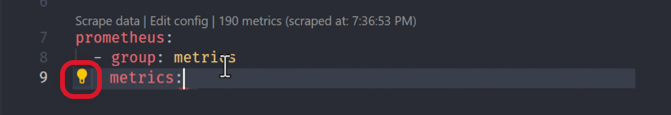
Code actions happen on key lines of your extension manifest. Your editor will automatically show a lightbulb icon whenever actions are relevant to the clicked line. Typically these will generate and insert content into your extension manifest or fix issues highlighted by Dynatrace Extensions.
Currently implemented triggers
| Action trigger | Effects |
|---|---|
Inside propertiesCard when clicking on properties | Automatically add properties for the entity's attributes and relations |
Inside entitiesListCards when clicking on columns | Automatically add columns for the listed entity's attributes and relations |
Inside chartsCards and entitiesListCards when clicking on charts inside a card | Automatically add charts for metrics that aren't already in the card |
Inside graphChartConfig when clicking on metrics | Add more metrics to your chart that aren't used within the surrounding card |
Inside screens when clicking on chartsCards | Automatically add chart cards for entire feature sets of metrics |
Inside screens when clicking on entitiesListCards | Automatically add cards for listing this entity as well as the related ones |
When clicking on metrics within the Prometheus data source | Automatically add details from a scraped Prometheus endpoint |
On screens | Automatically generate entire unified analysis screens for your entities |
Inside entitiesListCards when clicking on filtering | Insert entire filtering blocks with a default filter by name |
Inside entitiesListCards and inside filtering, when clicking on filters | Insert individual filter for the entity's attributes |
Inside screens when clicking on actions | Insert global actions to configure the extension |
Inside actions when clicking on actions | Insert an action expression to configure the extension |
Code lens
Code lenses are actionable, contextual information interspersed with your code. For Dynatrace Extensions, these can help trigger code-related actions to your Dynatrace environment or other external endpoints.
Metric selectors
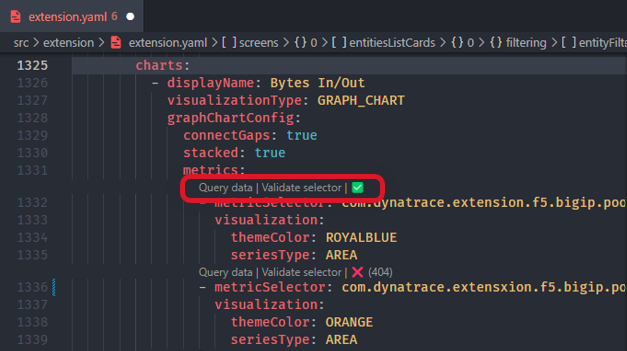
The lens appears automatically wherever metricSelector and shows:
- Query data - an action that runs the metric selector query and visualizes its results
- Validate selector - an action to verify this selector against your Dynatrace environment
- An icon representing the last validation status for this selector. You can hover over it for more details
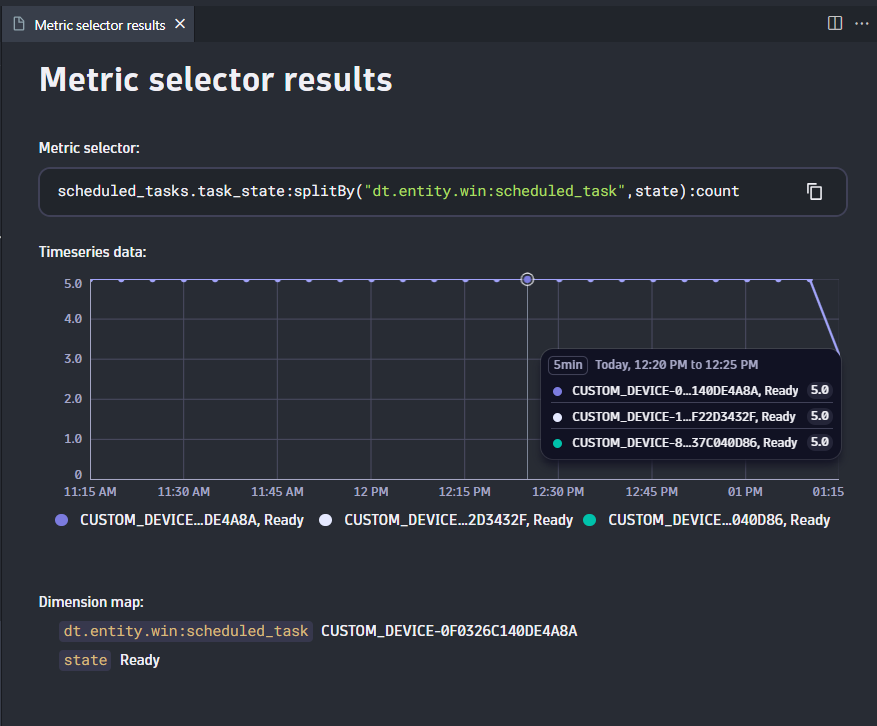
Metric selector results are displayed within a separate metric panel:
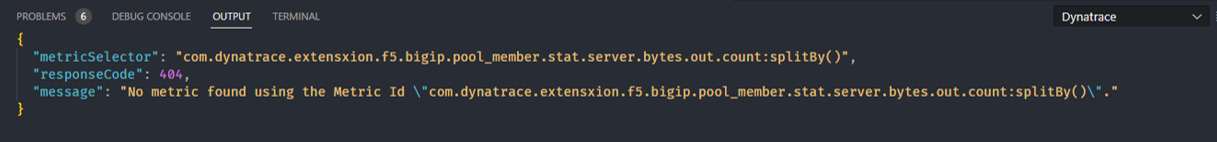
Any errors from querying your environment are displayed in the Dynatrace output panel (by default at the bottom of your editor):
Entity selectors
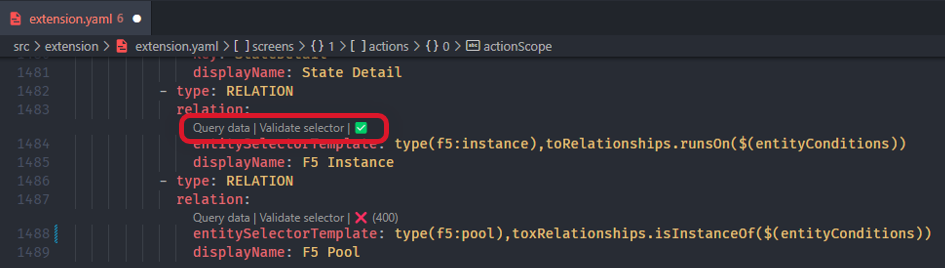
The lens appears automatically wherever entitySelector is mentioned and shows:
- Query data - an action that runs the entity selector query and visualizes its results
- Validate selector - an action to verify this selector against your Dynatrace environment
- An icon representing the last validation status for this selector. You can hover over it for more details
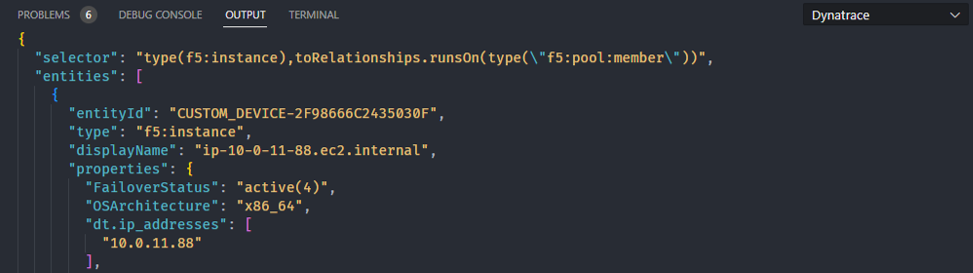
Entity selector results, as well as any errors, are displayed within the Dynatrace output panel (by default at the bottom of your editor):
Prometheus
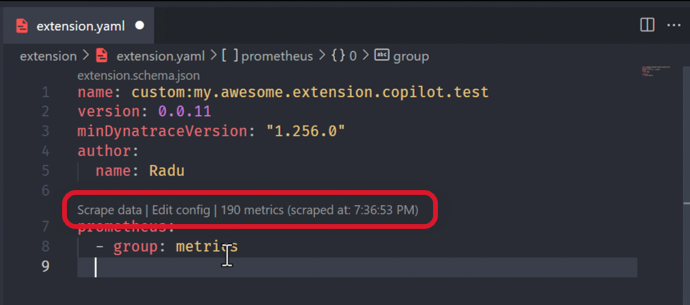
The lens appears automatically when the Prometheus data source is defined and shows:
- Scrape data - an action that connects to a Prometheus scraper endpoint and collects its data
- Edit config - an action that allows you to make changes to the connected Prometheus endpoint
- Text indicating the status of the last scrape action, such as the timestamp and number of metrics scraped
After the data has been scraped, this can be used with Code actions to:
- insert metric definitions in the
prometheussection of the manifest - insert dimensions in the
prometheussection of the manifest - insert metric metadata in the
metricssection of the manifest
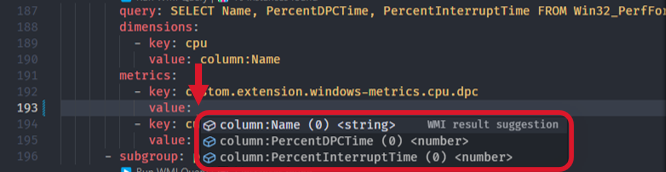
Windows Management Interface (WMI) queries
The lens appears automatically over queries inside the WMI data source definition and shows:
- Run WMI Query: an action that runs your query against the local Windows machine
- Text indicating the summary of the query results (i.e., how many object instances were found)
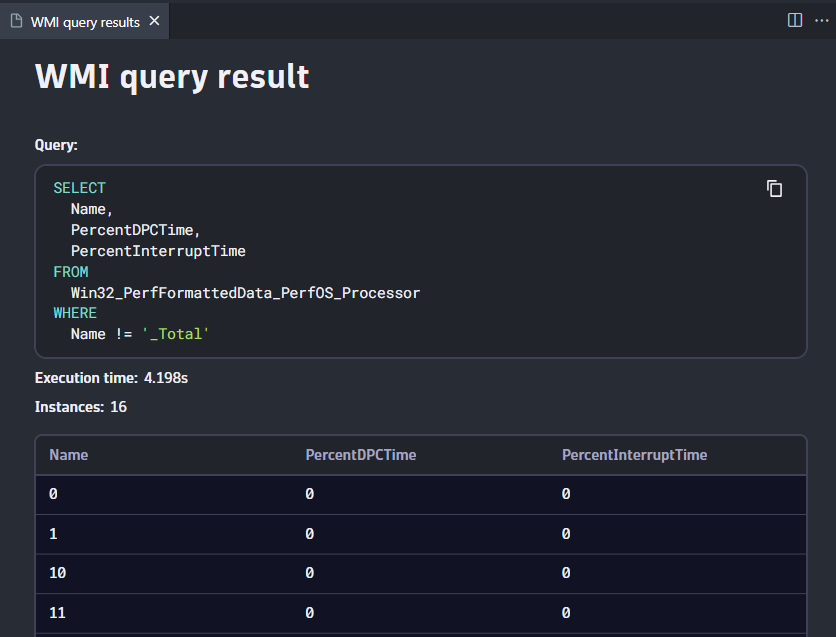
The full results of running the WMI query are displayed in a separate panel:
After a query is run, you can use the results with Code completions
Unified analysis screens
The lens appears automatically over entity type definitions inside the screens element of the manifest
and shows:
- Open List View: an action to open a browser window to this entity's Unified analysis list view
- Open Details view: an action to open a browser window to this entity's Unified analysis details view
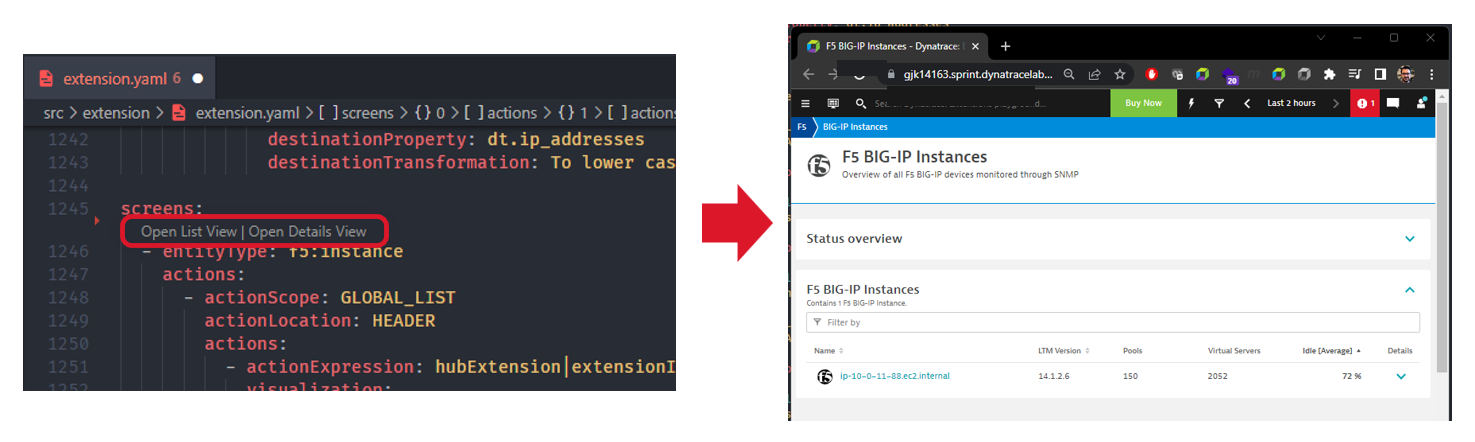
A 404 response code is expected if your entity type does exist yet.
Fast development mode
Fast development mode is a workflow designed to allow advanced developers to gain immediate feedback on the current state of their extension and minimize the steps and time it takes to see updates in their connected Dynatrace environment.
How does it work?
When enabled, every time the extension manifest saves, the extension version automatically increments, and the extension is packaged, signed, and uploaded to your connected environment. The workflow is hands-free, so if the maximum number of extension versions is reached, one will be removed automatically so the upload can succeed.
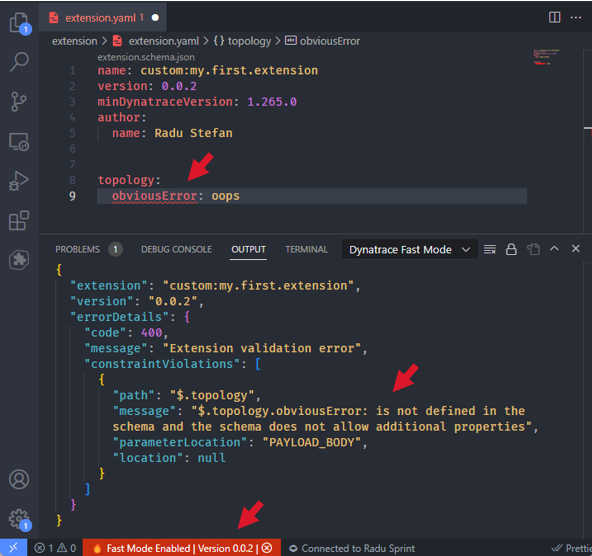
An accompanying status bar confirms the mode is active and displays the status of the last attempted build.

With this workflow, pre-upload validation is skipped in favor of speed, and any issues are communicated immediately via an output channel.
When developing your static assets, such as the unified analysis screens, this mode is the quickest way to cycle through a variety of changes before finding your ideal configuration.
Diagnostics
Often, perfectly valid YAML still produces a manifest that causes issues when we upload the extension to Dynatrace or later when it tries to run. Many of these situations can be caught early, and Dynatrace Extensions aims to bring these to light so you can fix them and reduce the number of failed deployment attempts.
How do custom diagnostics work?
On every edit of your extension manifest, the diagnostics suite will trigger an update of all diagnostic items applicable to that file. Based on findings, relevant content is highlighted within the manifest, and hovering over the highlight will provide more details about the issue.
Some issues may provide a Quick fix link as part of the hover information. If this is available, it will trigger a content change of the document to resolve the highlighted issue.
Diagnostic severities:
Error- these findings are highlighted in red and represent issues that would break your extension when deployed. The Build command won't work ifErrorseverity diagnostics are in your manifest.Warning- these findings are highlighted in yellow and represent issues that would not stop an extension from functioning but may still produce undesired behaviors.
Currently implemented diagnostics
| Code | Severity | What does it mean? |
|---|---|---|
| DED001 | Error | Your extension doesn't have a name, which is mandatory. |
| DED002 | Error | Your extension's name needs to be less that 50 character. characters. |
| DED003 | Error | Your extension's name is invalid. It should only contain lowercase letters, numbers, hyphens, underscores, or dots. |
| DED004 | Error | Your extension's name needs to start with custom: but it doesn't. |
| DED005 | Warning | Internal Dynatrace extension names shouldn't start with custom:. |
| DED006 | Warning | Metrics of type count should have keys ending in .count or _count. |
| DED007 | Warning | Metrics of type gauge shouldn't have keys ending in .count or _count. |
| DED008 | Error | You referenced this card key in a screen layout, but it doesn't have a definition. |
| DED009 | Warning | You defined this card, but you're not referencing it in the screen layout. |
| DED010 | Warning | There is no online data about this Object Identifier (OID). You may want to validate it. |
| DED011 | Error | This OID isn't readable. The access permissions (MAX-ACCESS) don't allow it. |
| DED012 | Error | This OID returns a string, but you're using it as a metric value. |
| DED013 | Warning | This OID returns a Counter, but you're using it as a Gauge metric. |
| DED014 | Warning | This OID returns a Gauge, but you're using it as a Counter metric. |
| DED015 | Error | Invalid OID syntax. OID shouldn't start/end with '.' and may only contain dots and digits. |
| DED016 | Error | Invalid OID syntax. OIDs shouldn't end in '.0' when 'table' is set to 'true' in the subgroup. |
| DED017 | Error | Invalid OID syntax. OIDs needs to end in '.0' when 'table' is set to 'false' in the subgroup. |
| DED018 | Error | Online data lists this OID as static, but you're using it inside a 'table' subgroup. |
| DED019 | Error | Online data maps this OID to table entries, but you're not using it inside a 'table' subgroup. |
The code itself doesn't mean anything; it just provides a unique identifier within all diagnostics that may come up in VS Code. We chose the DED prefix to stand for Dynatrace Extensions Diagnostic.