Create a Python extension
Dynatrace provides a means to develop Python extensions using the new Extensions 2.0 framework. You should use these extensions when the existing data sources can't cover your use cases.
Develop Python extensions when:
- You need complex logic to fetch metrics, events, or logs from a source.
- You can't achieve data collection with a declarative data source (SQL, SNMP, WMI, JMX, Prometheus, etc).
The dt-extensions-sdk python package provides a Software Development Kit (SDK) and a Command Line Interface (CLI) delivering support for your Python extension.
Python extensions are also supported by our Visual Studio Code Add-on, our recommended way of developing them.
In this step-by-step guide, we will create a working RabbitMQ extension from scratch.
This extension will leverage the RabbitMQ Management API to bring metrics for the cluster, nodes, and queues.
Requirements
You'll need the following:
- Visual Studio Code with the Extensions Add-On installed and configured.
- Python 3.10+
- dt-extensions-sdk
- Dynatrace 1.286+
Create a new extension
- Open an empty folder on Visual Studio Code.
- Run the command
Dynatrace extensions: Initialize workspace. - Choose the latest available schema version.
- Create a new certificate or use an existing one.
- Choose the project type
Python Extension 2.0. - Give the extension the name
rabbitmq_extension.
Python extensions are simply Python modules that must follow the PEP8 naming conventions, meaning that the name should be lowercase and separated by underscores.
To run a command on Visual Studio Code, press F1 or Ctrl+Shift+P and type the command name.
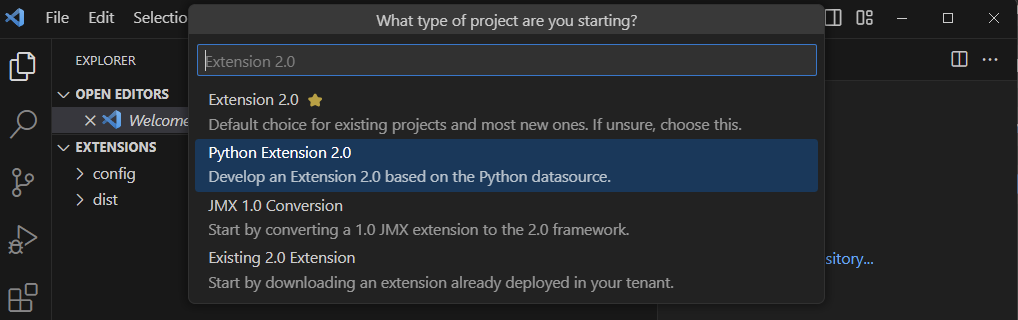
Our Visual Studio Code extension will automatically invoke the dt-sdk create command, which will create the necessary files and folders for the extension.
If you open the file extension/extension.yaml, you can examine the construction of a Python extension.
It declares the Python module name, the minimum Python version, and the activation schema for a remote ActiveGate or local OneAgent extension.
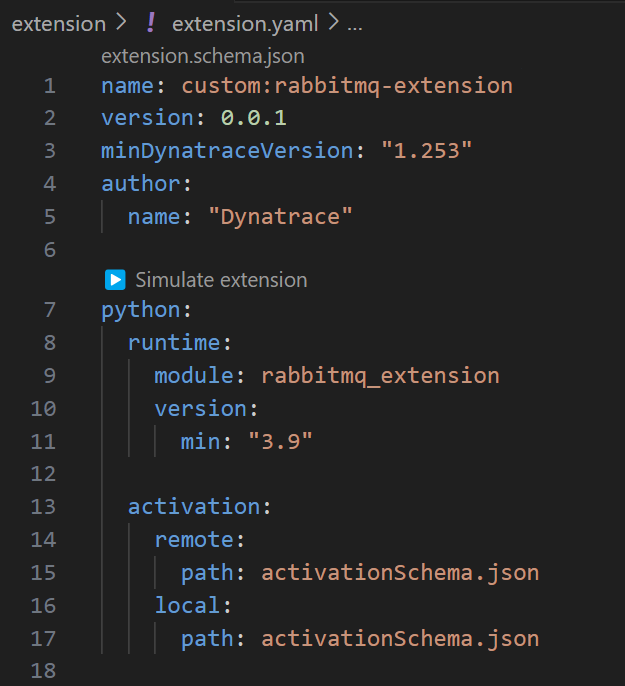
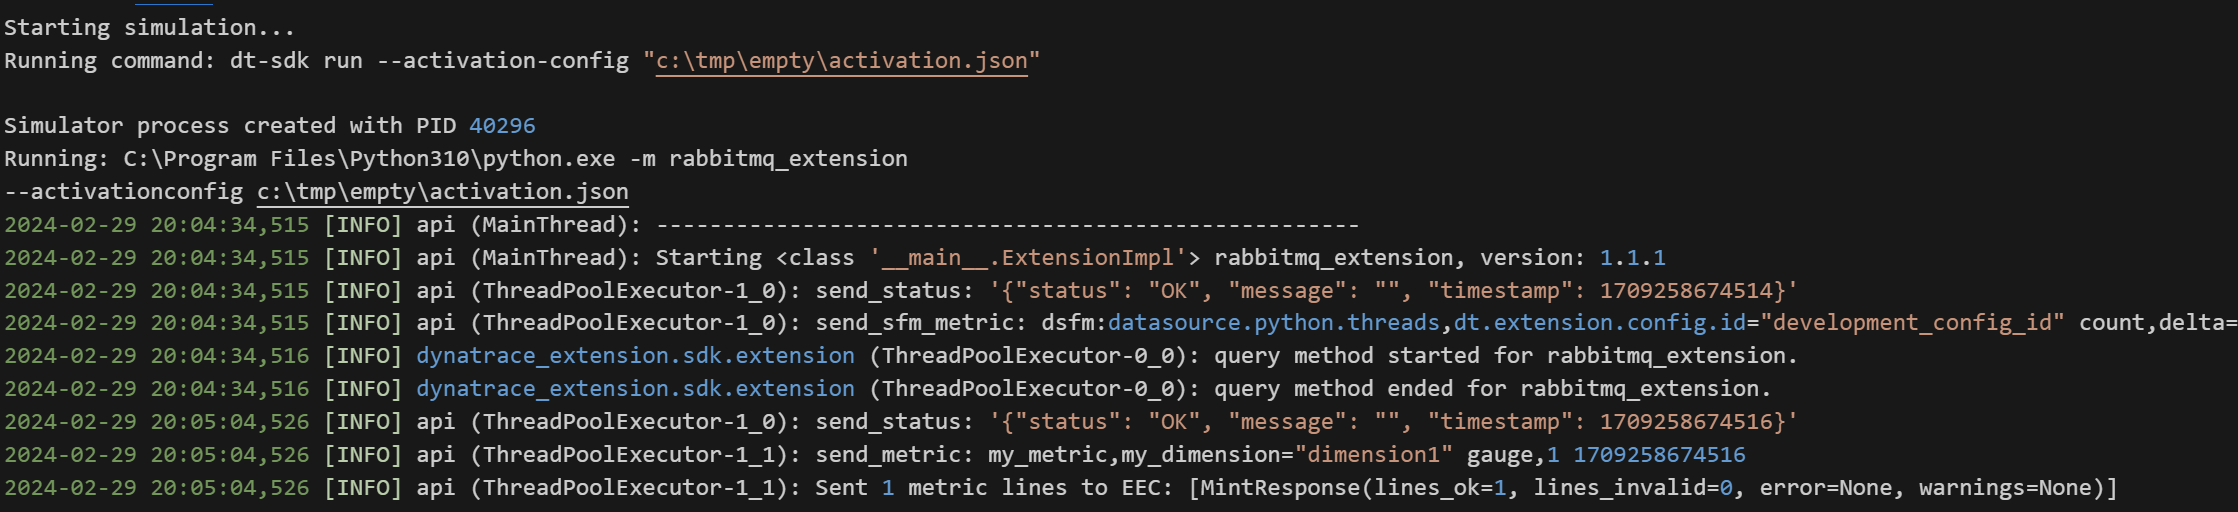
Clicking the Simulate extension code lens will start the extension in the Visual Studio Code environment.
If you don't see the Simulate extension button, reload the Visual Studio Code window with F1 > Reload Window.
RabbitMQ
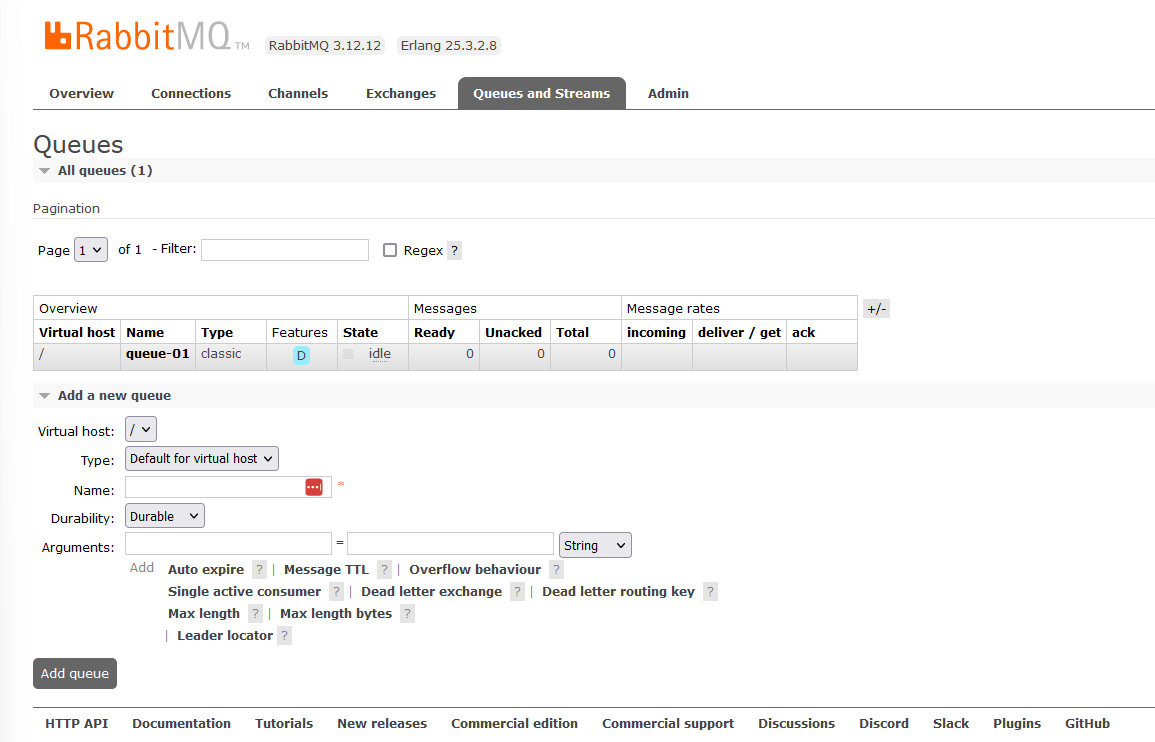
We suggest you use docker to test this extension against a real RabbitMQ broker.
You can start a RabbitMQ node with the management extension enabled by:
docker run -d --name rabbit -p 15672:15672 rabbitmq:3-management
To make the extension more interesting, log in to http://localhost:15672 with the default credentials guest:guest and create a new queue.
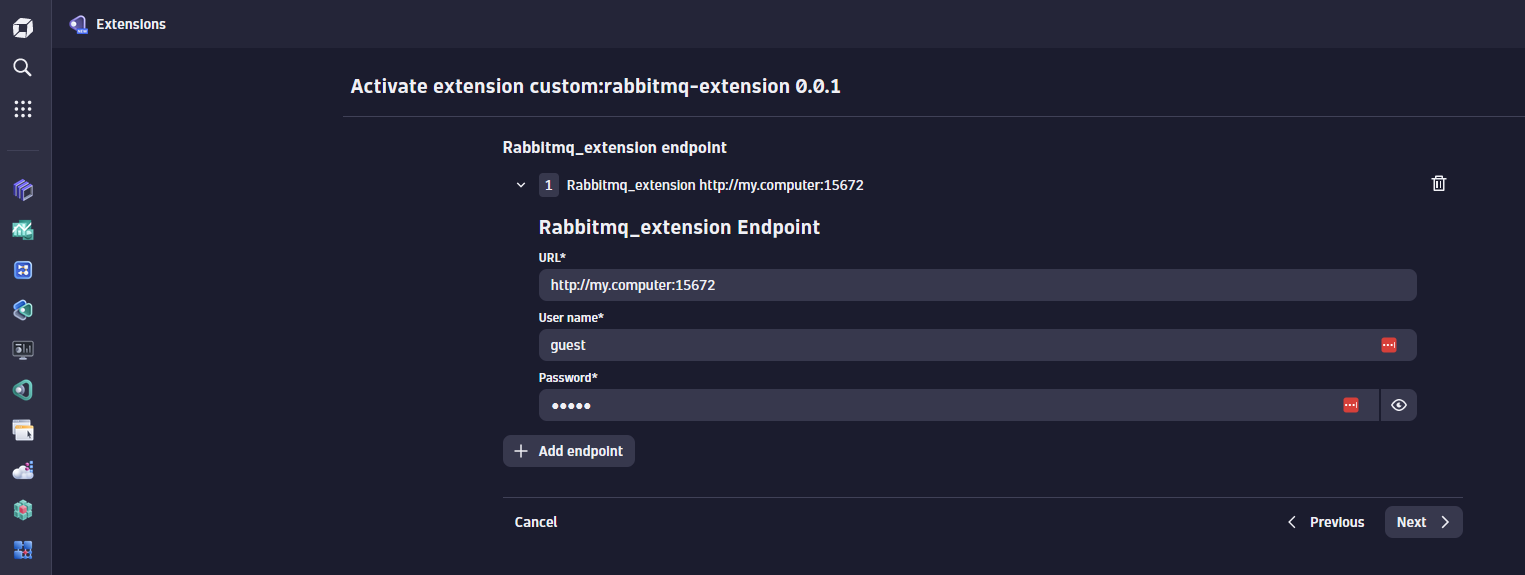
Activation schema
We need to ask the user for three pieces of information when they're configuring our extension:
- RabbitMQ Management URL
- Username
- Password
You can define these in the extension/activationSchema.json file.
By default, the SDK creates this file with fields for a URL, Username, and Password, which is convenient for us.
You should modify this file to fit the specific needs of the extension for most use cases.
During development, the SDK reads these configuration values from the file activation.json. Modify this file to point to our local RabbitMQ instance.
{
  "enabled": true,
  "description": "rabbitmq_extension activation",
  "version": "0.0.1",
  "activationContext": "REMOTE",
  "pythonRemote": {
    "endpoints": [
      {
        "url": "http://localhost:15672",
        "user": "guest",
        "password": "guest"
      }
    ]
  }
}
You can only use the activation.json during development, and it's not bundled with the extension. You must be careful not to commit secrets to your source control accidentally.
Fetch the data
In this section, we will implement the query method of the extension. This method is called every minute and is responsible for fetching the data from the RabbitMQ instance.
Cluster level metrics
Let's start by reporting a metric for the number of queues in our RabbitMQ instance.
To do that, we can call the /api/overview endpoint.
We will also need to include requests as a dependency of our extension.
from dynatrace_extension import Extension, Status, StatusValue
import requests

class ExtensionImpl(Extension):

    def initialize(self):
        self.extension_name = "rabbitmq_extension"

    def query(self):
        """
        The query method is automatically scheduled to run every minute
        """
        self.logger.info("query method started for rabbitmq_extension.")

        for endpoint in self.activation_config["endpoints"]:
            url = endpoint["url"]
            user = endpoint["user"]
            password = endpoint["password"]
            self.logger.debug(f"Running endpoint with url '{url}'")

            # We've added these three lines
            # 1 - Make a request to the /api/overview endpoint
            cluster = requests.get(f"{url}/api/overview", auth=(user, password)).json()

            # 2 - Collect some dimensions for our metrics
            dimensions = {
                "cluster": cluster["cluster_name"],
                "rabbitmq_version": cluster["rabbitmq_version"]
            }

            # 3 - Send a metric to Dynatrace
            self.report_metric("rabbitmq.cluster.queues", cluster["object_totals"]["queues"], dimensions)

        self.logger.info("query method ended for rabbitmq_extension.")

    def fastcheck(self) -> Status:
        """
        This is called when the extension runs for the first time.
        If this AG cannot run this extension, raise an Exception or return StatusValue.ERROR!
        """
        return Status(StatusValue.OK)


def main():
    ExtensionImpl().run()


if __name__ == '__main__':
    main()
To include requests as a dependency, add it to install_requires in setup.py:
from setuptools import setup, find_packages

setup(name="rabbitmq_extension",
      version="0.0.1",
      description="Rabbitmq_extension python EF2 extension",
      author="Dynatrace",
      packages=find_packages(),
      python_requires=">=3.10",
      include_package_data=True,
      install_requires=["dt-extensions-sdk", "requests"],
      extras_require={"dev": ["dt-extensions-sdk[cli]"]},
      )
Don't forget to also install the requests package in your development environment
with pip install requests
Running the extension should now show you a metric being collected:
2024-02-29 21:42:56,099 [INFO] api (MainThread): send_metric: rabbitmq.cluster.queues,
cluster="rabbit@49bf21ab3628",rabbitmq_version="3.12.12" gauge,1 1709264569592
For this tutorial, we won't add more metrics but you can visit the RabbitMQ Management API in your local instance and add more metrics to your extension.
Node level metrics
Adding metrics to the nodes of the RabbitMQ cluster is a similar process.
A cluster can have many nodes, so let's loop through them and report some metrics.
Add the following lines after reporting the cluster metric:
            # 4 - Get nodes
            nodes = requests.get(f"{url}/api/nodes", auth=(user, password)).json()
            for node in nodes:

                # 5 - Add node specific dimensions, including it's parent (the cluster) dimensions
                node_dimensions = {
                    "node": node["name"],
                    **dimensions
                }

                # 6 - Report a metric for each node
                self.report_metric("rabbitmq.node.mem_used", node["mem_used"], node_dimensions)
Queue level metrics
Finally, let's add some metrics for the queues in our RabbitMQ instance.
            # 7 - Get queues
            queues = requests.get(f"{url}/api/queues", auth=(user, password)).json()
            for queue in queues:

                # 8 - Add queue specific dimensions, including it's parent (the cluster) dimensions
                queue_dimensions = {
                    "name": queue["name"],
                    "node": queue["node"],
                    "state": queue["state"],
                    **dimensions
                }

                # 9 - Report a metric for each queue
                self.report_metric("rabbitmq.queue.messages", queue["messages"], queue_dimensions)
Final code
from dynatrace_extension import Extension, Status, StatusValue
import requests

class ExtensionImpl(Extension):

    def initialize(self):
        self.extension_name = "rabbitmq_extension"

    def query(self):
        """
        The query method is automatically scheduled to run every minute
        """
        self.logger.info("query method started for rabbitmq_extension.")

        for endpoint in self.activation_config["endpoints"]:
            url = endpoint["url"]
            user = endpoint["user"]
            password = endpoint["password"]
            self.logger.debug(f"Running endpoint with url '{url}'")

            # We've added these three lines
            # 1 - Make a request to the /api/overview endpoint
            cluster = requests.get(f"{url}/api/overview", auth=(user, password)).json()

            # 2 - Collect some dimensions for our metrics
            dimensions = {
                "cluster": cluster["cluster_name"],
                "rabbitmq_version": cluster["rabbitmq_version"]
            }

            # 3 - Send a metric to Dynatrace
            self.report_metric("rabbitmq.cluster.queues", cluster["object_totals"]["queues"], dimensions)

            # 4 - Get nodes
            nodes = requests.get(f"{url}/api/nodes", auth=(user, password)).json()
            for node in nodes:

                # 5 - Add node specific dimensions, including it's parent (the cluster) dimensions
                node_dimensions = {
                    "node": node["name"],
                    **dimensions
                }

                # 6 - Report a metric for each node
                self.report_metric("rabbitmq.node.mem_used", node["mem_used"], node_dimensions)

            # 7 - Get queues
            queues = requests.get(f"{url}/api/queues", auth=(user, password)).json()
            for queue in queues:

                # 8 - Add queue specific dimensions, including it's parent (the cluster) dimensions
                queue_dimensions = {
                    "name": queue["name"],
                    "node": queue["node"],
                    "state": queue["state"],
                    **dimensions
                }

                # 9 - Report a metric for each queue
                self.report_metric("rabbitmq.queue.messages", queue["messages"], queue_dimensions)


        self.logger.info("query method ended for rabbitmq_extension.")

    def fastcheck(self) -> Status:
        """
        This is called when the extension runs for the first time.
        If this AG cannot run this extension, raise an Exception or return StatusValue.ERROR!
        """
        return Status(StatusValue.OK)


def main():
    ExtensionImpl().run()


if __name__ == '__main__':
    main()
You should separate the query method into smaller methods.
For the complete code you can visit our real RabbitMQ extension in Github that includes dashboards, topology, screens, all metrics, and more.
Build the extension
If you haven't done it yet, you can generate developer certificates using the
Visual Studio Code command
Dynatrace extensions: Generate certificates. For more information about this command,
visit the Generate certificates documentation.
To create the extension package, run the Dynatrace extensions: Build command.
This command will run the dt-sdk build command,
which will create the custom_rabbitmq-extension-0.0.1.zip file in the dist folder,
a signed extension file.
Dynatrace will only run extensions signed by a trusted certificate.
The Visual Studio Code extension will also prompt you to upload the extension to your Dynatrace environment, a nice quality of life feature.
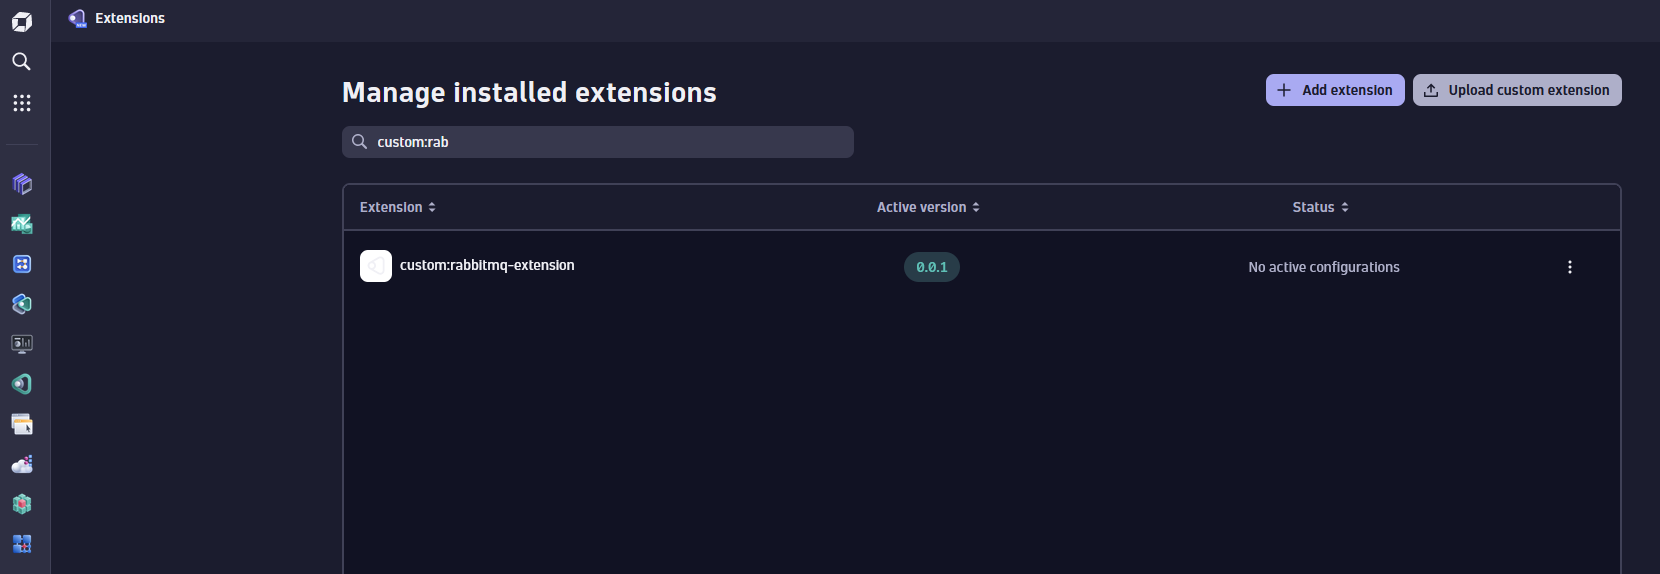
Configure the extension
Navigate to Dynatrace and configure your extension.
You can use the Extensions app from the Hub,
or navigate to Infrastructure Observability and then to Extensions
to configure your extension.
It must trust your developer certificate to run this extension from an ActiveGate or OneAgent.
To find information on how to distribute it, visit Sign extensions documentation.
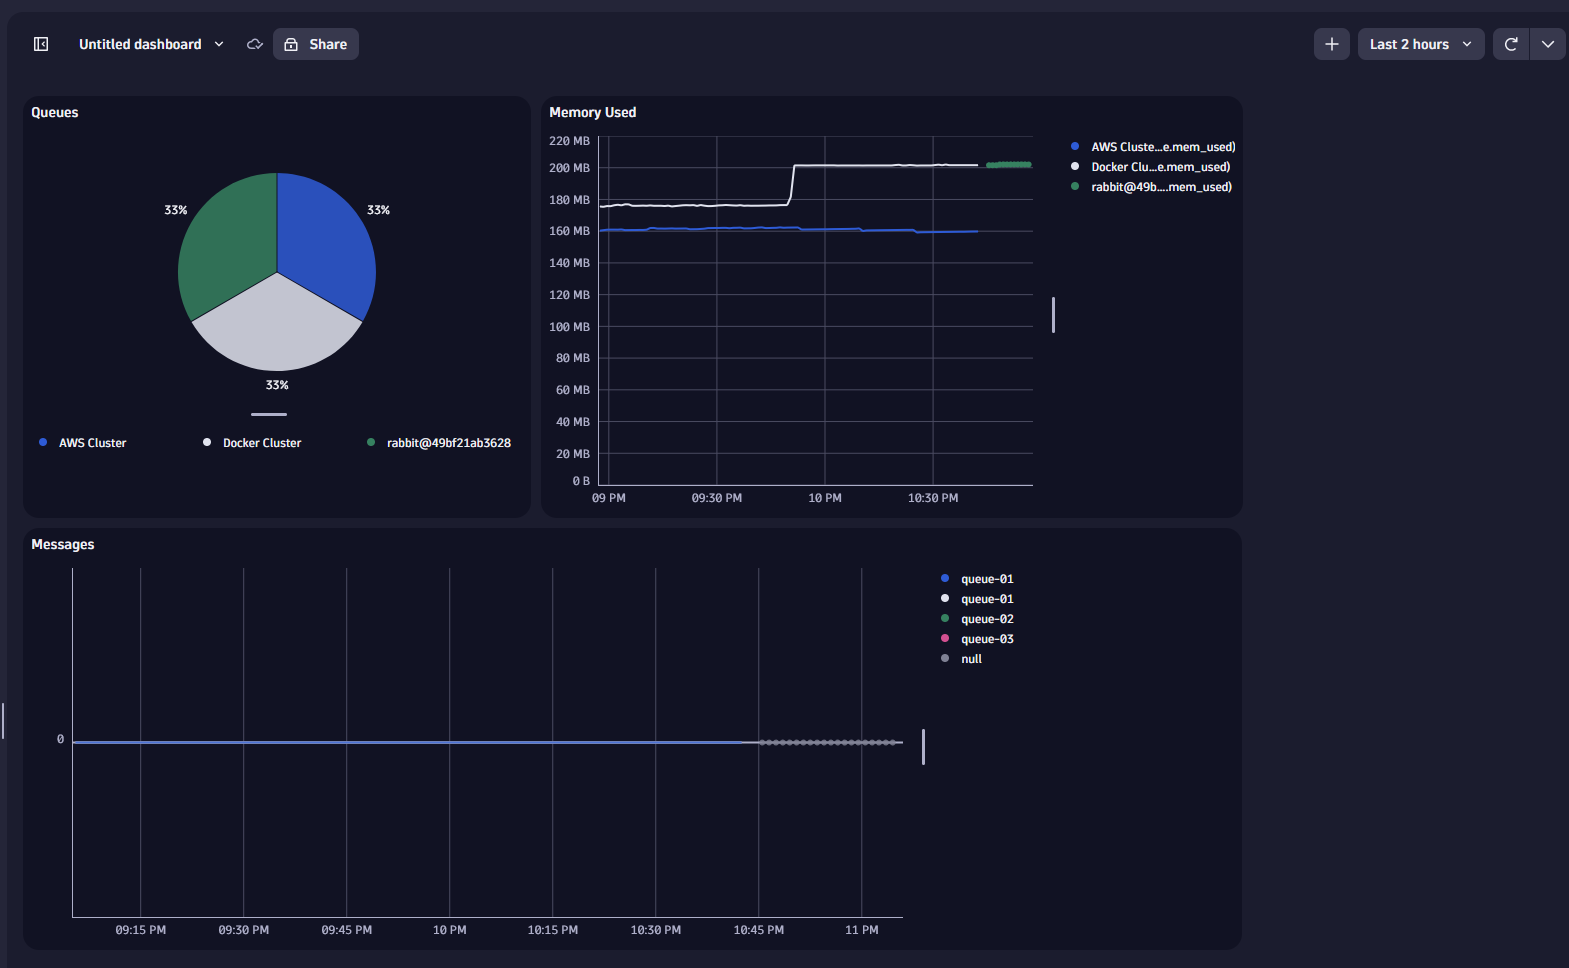
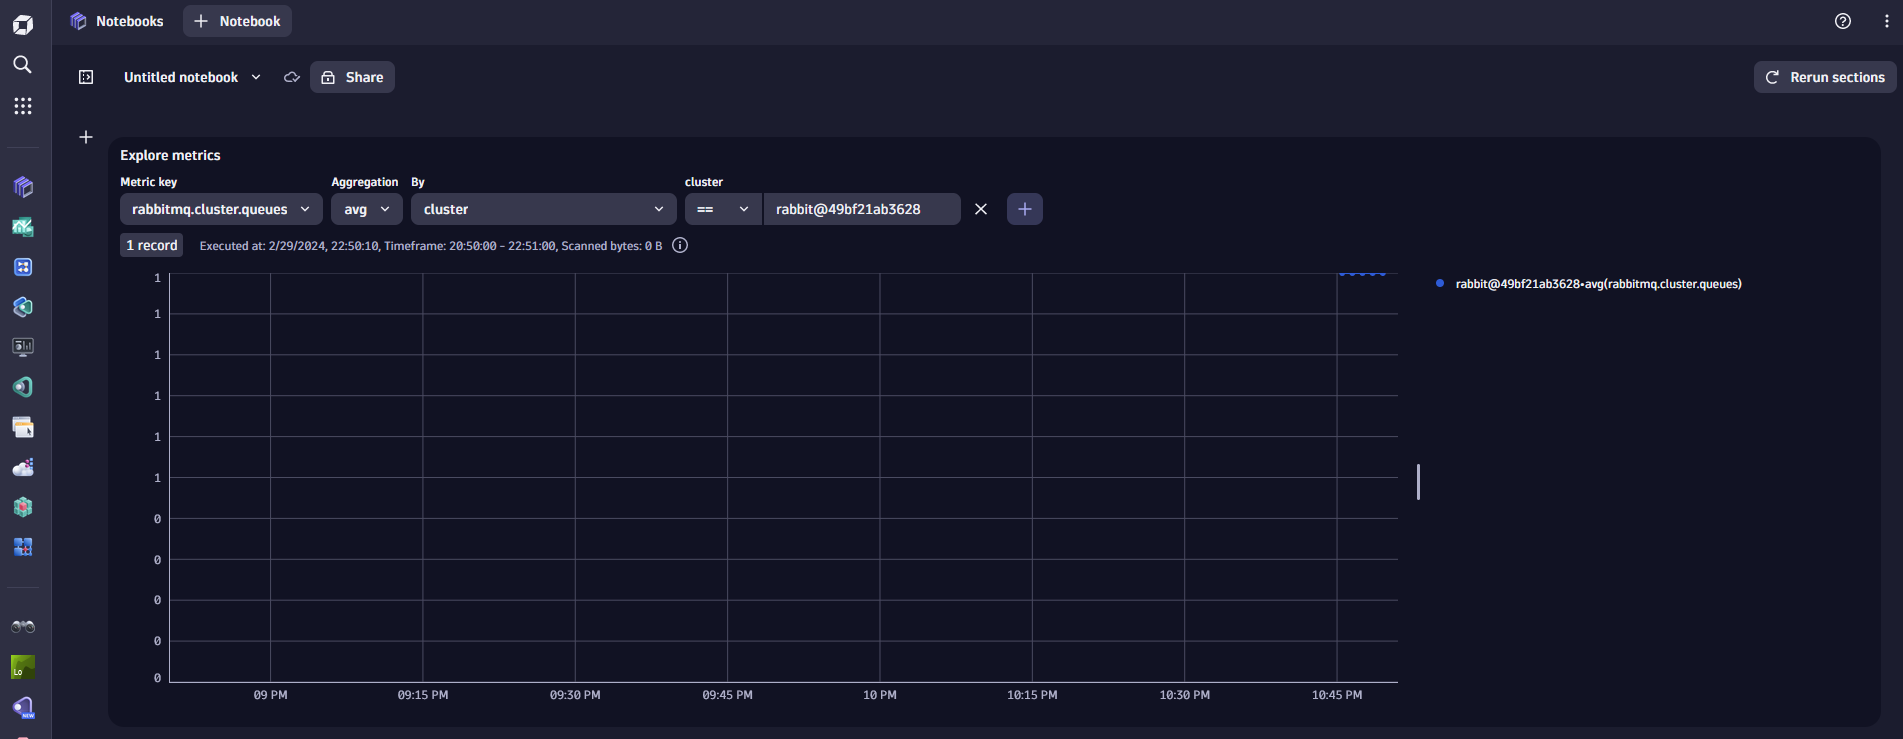
Visualize data
For now, we're only sending metric data points to Dynatrace.
We can visualize these metrics via Dashboards, Notebooks or the Metric Explorer:
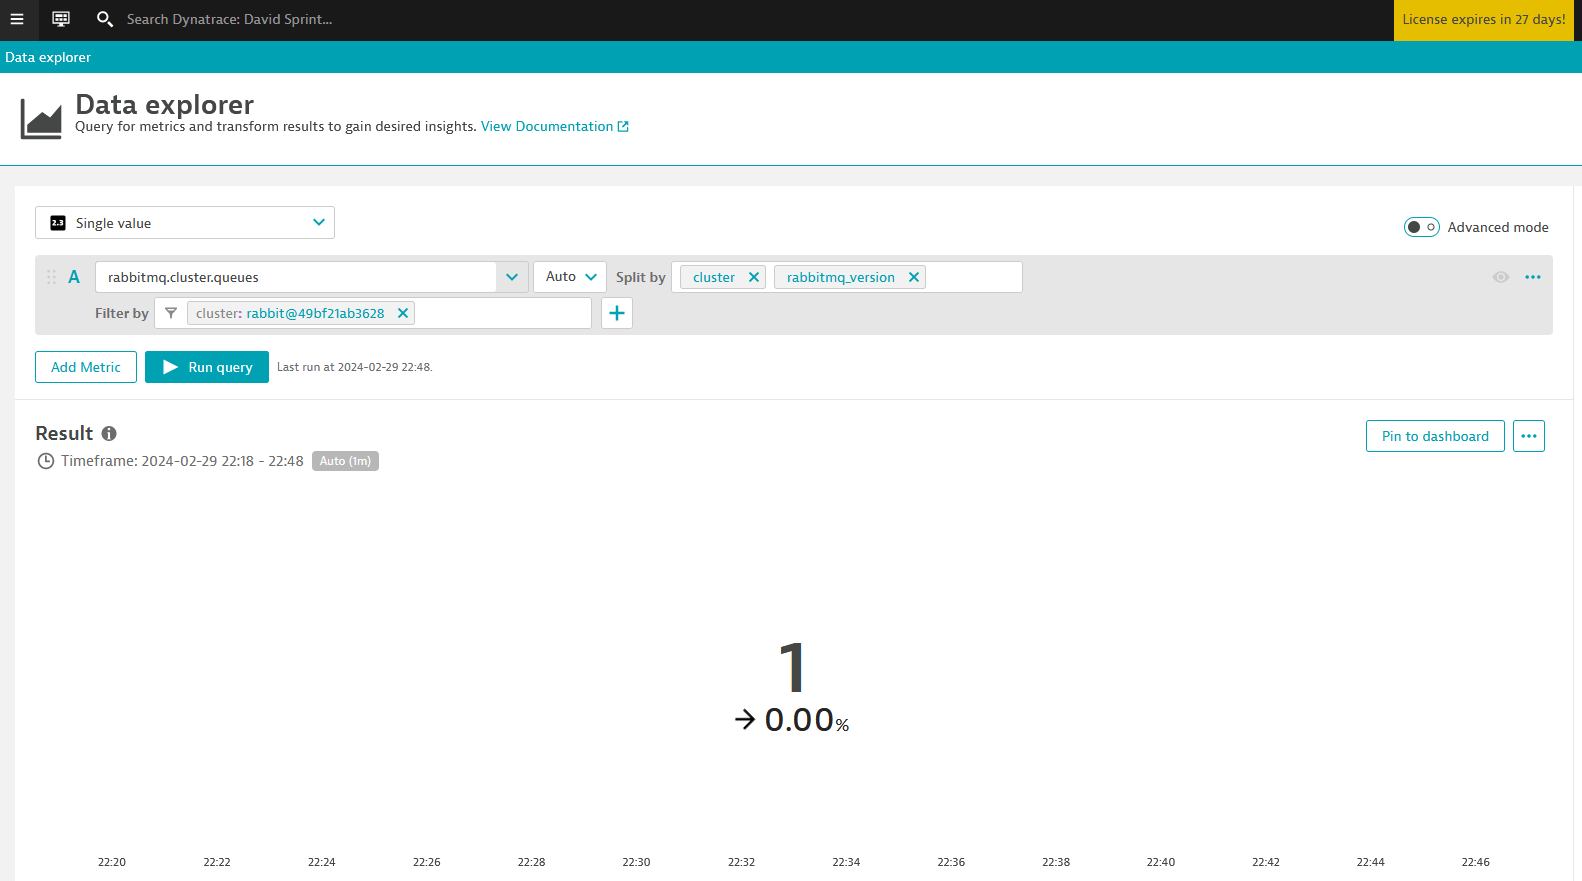
A full fledged extension would include dashboards, topology, screens, and more. For the complete code example, visit RabbitMQ extension on GitHub. For more information about extending Dynatrace, visit Extend Dynatrace documentaion.